
Case: Read the passage and answer the question.
We now study the relation between the frequency \( \nu \) of the incident radiation and the stopping potential \( V_0 \). We suitably adjust the same intensity of light radiation at various frequencies and study the variation of photocurrent with collector plate potential. The resulting variation is shown in the figure. We obtain different values of stopping potential but the same value of the saturation current for incident radiation of different frequencies. The energy of the emitted electrons depends on the frequency of the incident radiation. The stopping potential is more negative for higher frequencies of incident radiation. Note from the figure that the stopping potentials are in the order \( V_{03}\gt V_{02}\gt V_{01} \) if the frequencies are in the order \( \nu_3\gt \nu_2\gt \nu_1 \). This implies that the greater the frequency of incident light, the greater is the maximum kinetic energy of the photoelectrons. Consequently, we need a greater retarding potential to stop them completely.
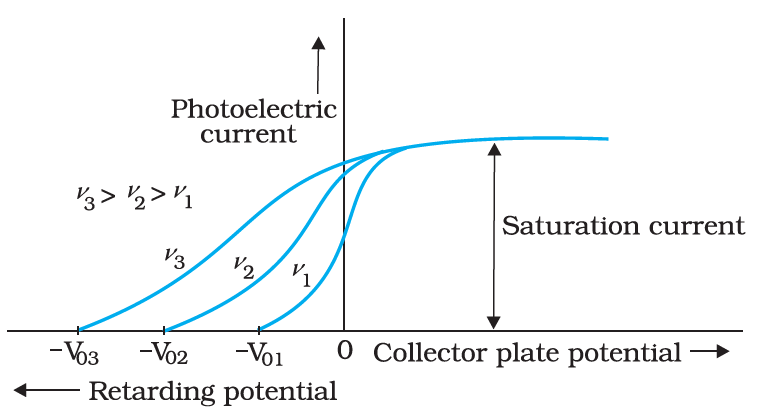
In the experiment shown in the figure, the intensity of the radiation of frequency \( \nu_2 \) alone is now doubled. How does the curve for \( \nu_2 \) change?
Answer & explanation
Correct answer: option 4
The correct answer is Option (4) → The saturation current doubles and the curve still meets the potential axis at \( -V_{02} \).
Raising the intensity while keeping the frequency fixed sends more photons per second, each with the same energy \( h\nu_2 \). The saturation current counts all the photoelectrons emitted per second. The stopping potential measures the maximum kinetic energy, \( eV_0=K_{max} \). From the figure, the curve for \( \nu_2 \) saturates at the common saturation current and cuts the potential axis at \( -V_{02} \).
Option (1) The saturation current stays the same and the curve still meets the potential axis at \( -V_{02} \). — Incorrect. Twice the intensity gives twice as many photoelectrons per second. The saturation current collects all of them, so it cannot stay at its old value.
Option (2) The saturation current stays the same and the curve meets the potential axis farther to the left of \( -V_{02} \). — Incorrect. A cut-off farther to the left would need faster photoelectrons. Their maximum kinetic energy depends on the frequency \( \nu_2 \), which has not changed. The saturation current also changes here.
Option (3) The saturation current doubles and the curve meets the potential axis at \( -2V_{02} \). — Incorrect. The saturation current does double, but each photon still has the energy \( h\nu_2 \). The maximum kinetic energy, and so the stopping potential \( V_{02} \), stays the same.
Option (4) The saturation current doubles and the curve still meets the potential axis at \( -V_{02} \). — Correct. The saturation current is proportional to the intensity, so it becomes twice as large. The stopping potential is independent of the intensity for a given frequency. The new curve rises to a higher flat part but starts from the same point \( -V_{02} \).
NCERT (2026-27):
Effect of Frequency of Incident Radiation on Stopping Potential – “… For a given photosensitive material and frequency of incident radiation, saturation current is found to be proportional to the intensity of incident radiation whereas the stopping potential is independent of its intensity ….”