CUET Preparation Today
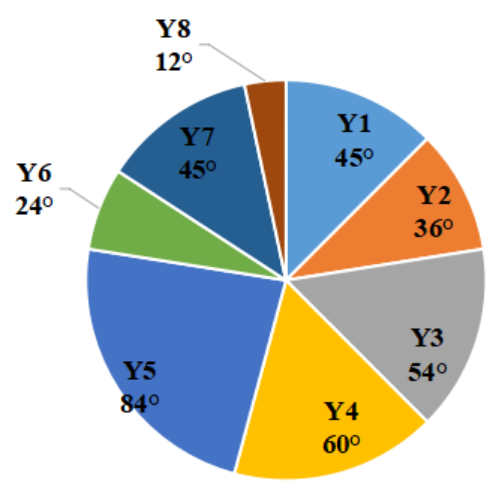
Study the given pie-chart and answer the question that follows. The following pie chart shows the sectors representing the shares of the number of matches played by a team in each of eight consecutive years in terms of the central angles (in degrees) with respect to the total number of matches played by the team in all the eight years taken together.
The total number of matches played by the team in the years Y2 and Y8 taken together is approximately what percentage of the total number of matches played by the team in all the eight years taken together? |
13.33% 15.75% 10.25% 14.28% |
13.33% |
Percentage of time match played by Y2 & Y8 comparative to all = \(\frac{36 + 12 }{360}\) × 100 = = \(\frac{48 }{360}\) × 100 = 13.33% |