
The bar graph shows the production of salt (in lakh tonnes) by three companies A, B and C from 2016 to 2020.
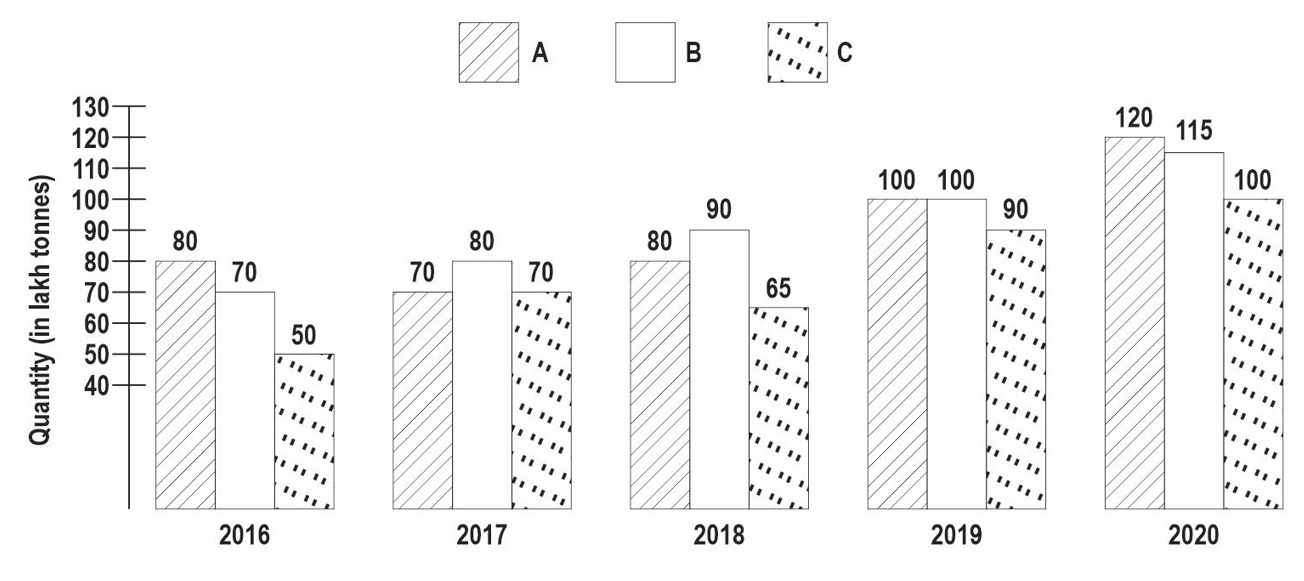
What is the ratio of the production of company A in 2016 to the average yearly production of company B from 2016 to 2020?
Answer & explanation
Correct answer: option 1
The correct answer is Option (1) → 80 : 91
The average production of B is the total of its five bars divided by 5; the ratio then compares A's 2016 bar with this average.
Company A in 2016 = 80 lakh tonnes
Company B: 70, 80, 90, 100, 115; total \(=455\)
Average of B \(\displaystyle=\frac{455}{5}=91\) lakh tonnes
Ratio \(=80:91\)