
Statement I: Genes that are very tightly linked on a chromosome show very low recombination, while loosely linked genes show higher recombination.
Statement II: Genetic maps are extensively used as a starting point in the sequencing of whole genomes, as was done in the Human Genome Sequencing Project.
Answer & explanation
Correct answer: option 3
The correct answer is Option (3) → Both statements I and II are correct.
Linkage is the physical association of genes on the same chromosome. Recombination is the formation of non-parental gene combinations. Morgan found that genes on one chromosome do not all behave alike: the closer two genes lie, the less often they are separated.
Statement I: Genes that are very tightly linked on a chromosome show very low recombination, while loosely linked genes show higher recombination. — True. In Morgan’s crosses, the tightly linked genes white and yellow gave very few recombinants, while white and miniature wing gave many more. So the strength of linkage and the amount of recombination are opposite.
Statement II: Genetic maps are extensively used as a starting point in the sequencing of whole genomes, as was done in the Human Genome Sequencing Project. — True. Sturtevant used the frequency of recombination as a measure of the distance between genes and mapped their positions. Such genetic maps are today the starting point for sequencing whole genomes.
NCERT Extract:
Linkage and Recombination – “… Morgan and his group also found that even when genes were grouped on the same chromosome, some genes were very tightly linked (showed very low recombination) (Figure 4.11, Cross A) while others were loosely linked (showed higher recombination) (Figure 4.11, Cross B). For example he found that the genes white and yellow were very tightly linked and showed only 1.3 per cent recombination while white and miniature wing showed 37.2 per cent recombination. His student Alfred Sturtevant used the frequency of recombination between gene pairs on the same chromosome as a measure of the distance between genes and ‘mapped’ their position on the chromosome. Today genetic maps are extensively used as a starting point in the sequencing of whole genomes as was done in the case of the Human Genome Sequencing Project, described later.”
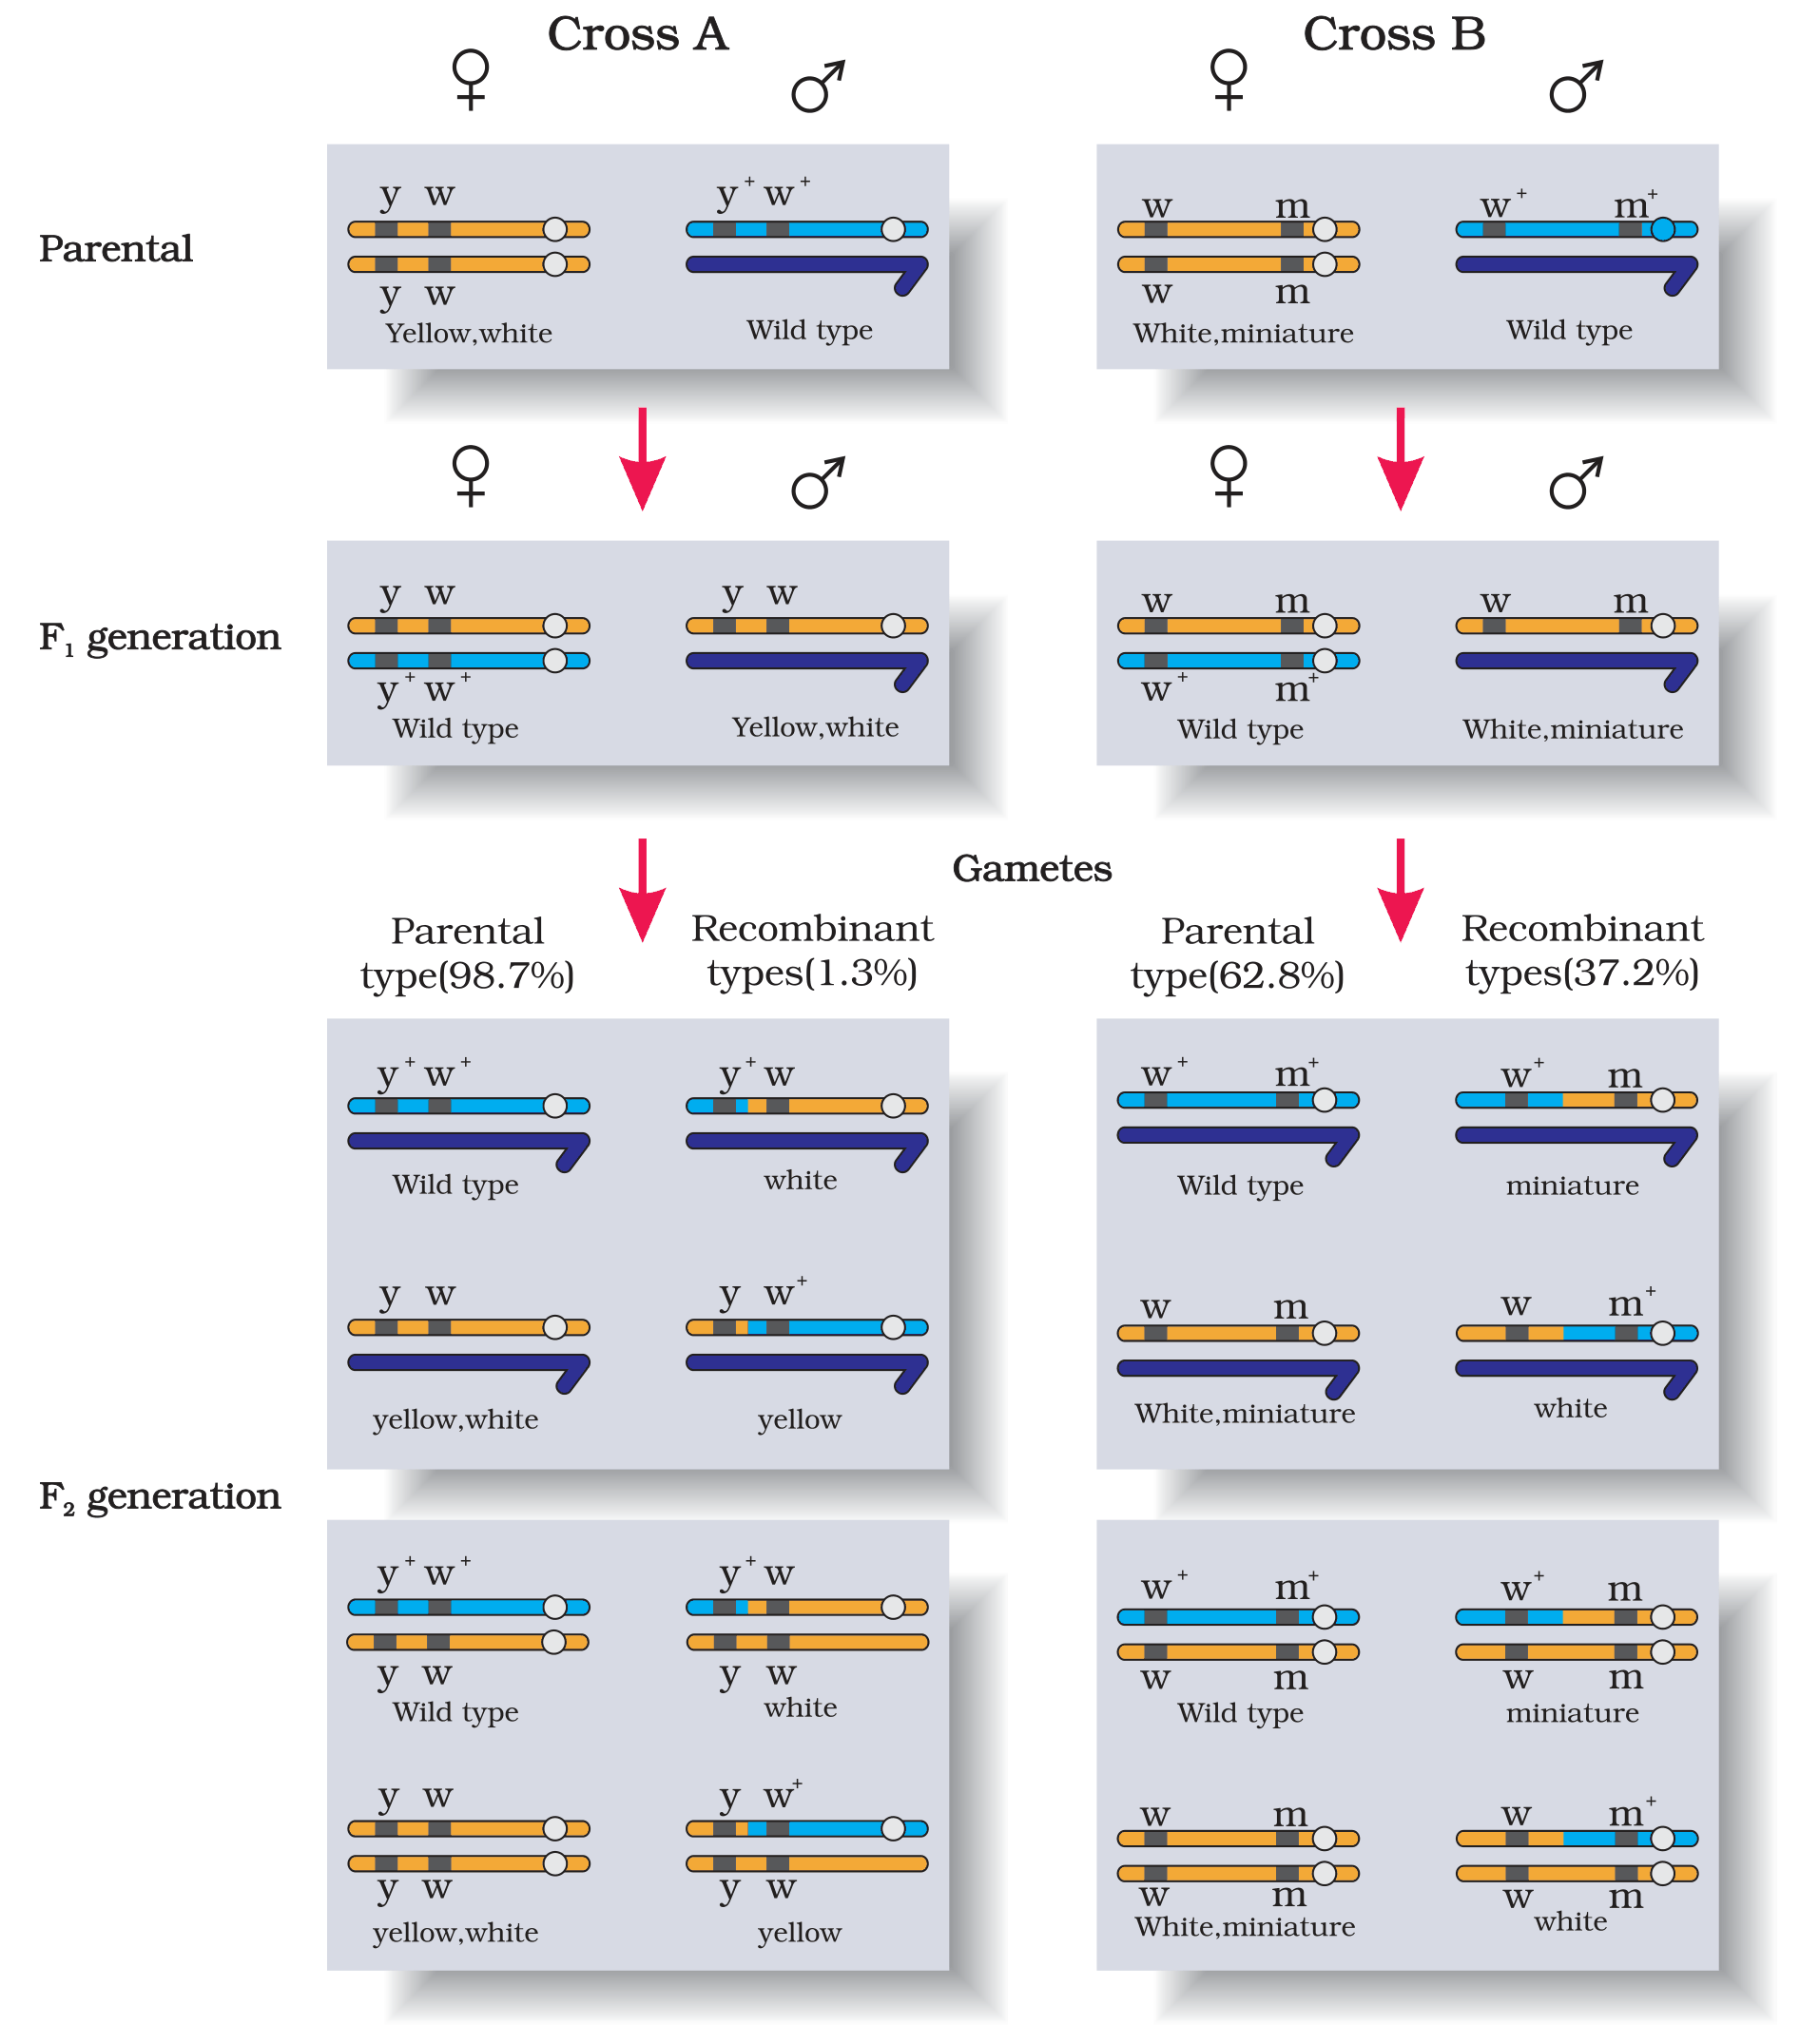
Figure 4.11 Linkage: Results of two dihybrid crosses conducted by Morgan. Cross A shows crossing between gene y and w; Cross B shows crossing between genes w and m. Here dominant wild type alleles are represented with (+) sign in superscript. Note: The strength of linkage between y and w is higher than w and m.