CUET Preparation Today
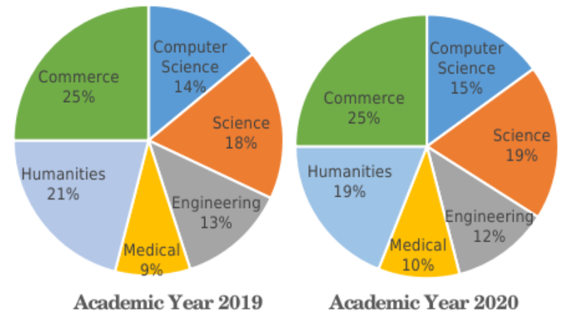
The following pie-charts show the number of students studying in different departments of an institute during the academic years 2019 and 2020 . The total number of students was 2000 and 2400, respectively, in academic years 2019 and 2020. What is the ratio of the number of students studying science in the year 2019 to that in the year 2020 ?
|
18 : 19 20 : 21 15 : 19 14 : 15 |
15 : 19 |
Science students in 2019 : Science students in 2020 \(\frac{18}{100}\) × 2000 : \(\frac{19}{100}\) × 2400 360 : 456 15 : 19 |