Match List-I with List-II.
| List-I | List-II |
| (A) ed = ∞ | (I) Shift in the curve |
| (B) ed = 0 | (II) Movement along the curve |
(C) 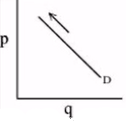 | (III) Perfectly elastic |
(D) 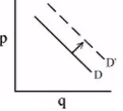 | (IV) Perfectly inelastic |
Choose the correct answer from the options given below :
Answer & explanation
Correct answer: option 4
The correct answer is Option (4) → A-III, B-IV, C-II, D-I
Price elasticity of demand (ed) measures how much the quantity demanded responds to a change in price. A change in the good’s own price and a change in anything else show up differently on the graph.
| List-I | List-II | Reason |
|---|---|---|
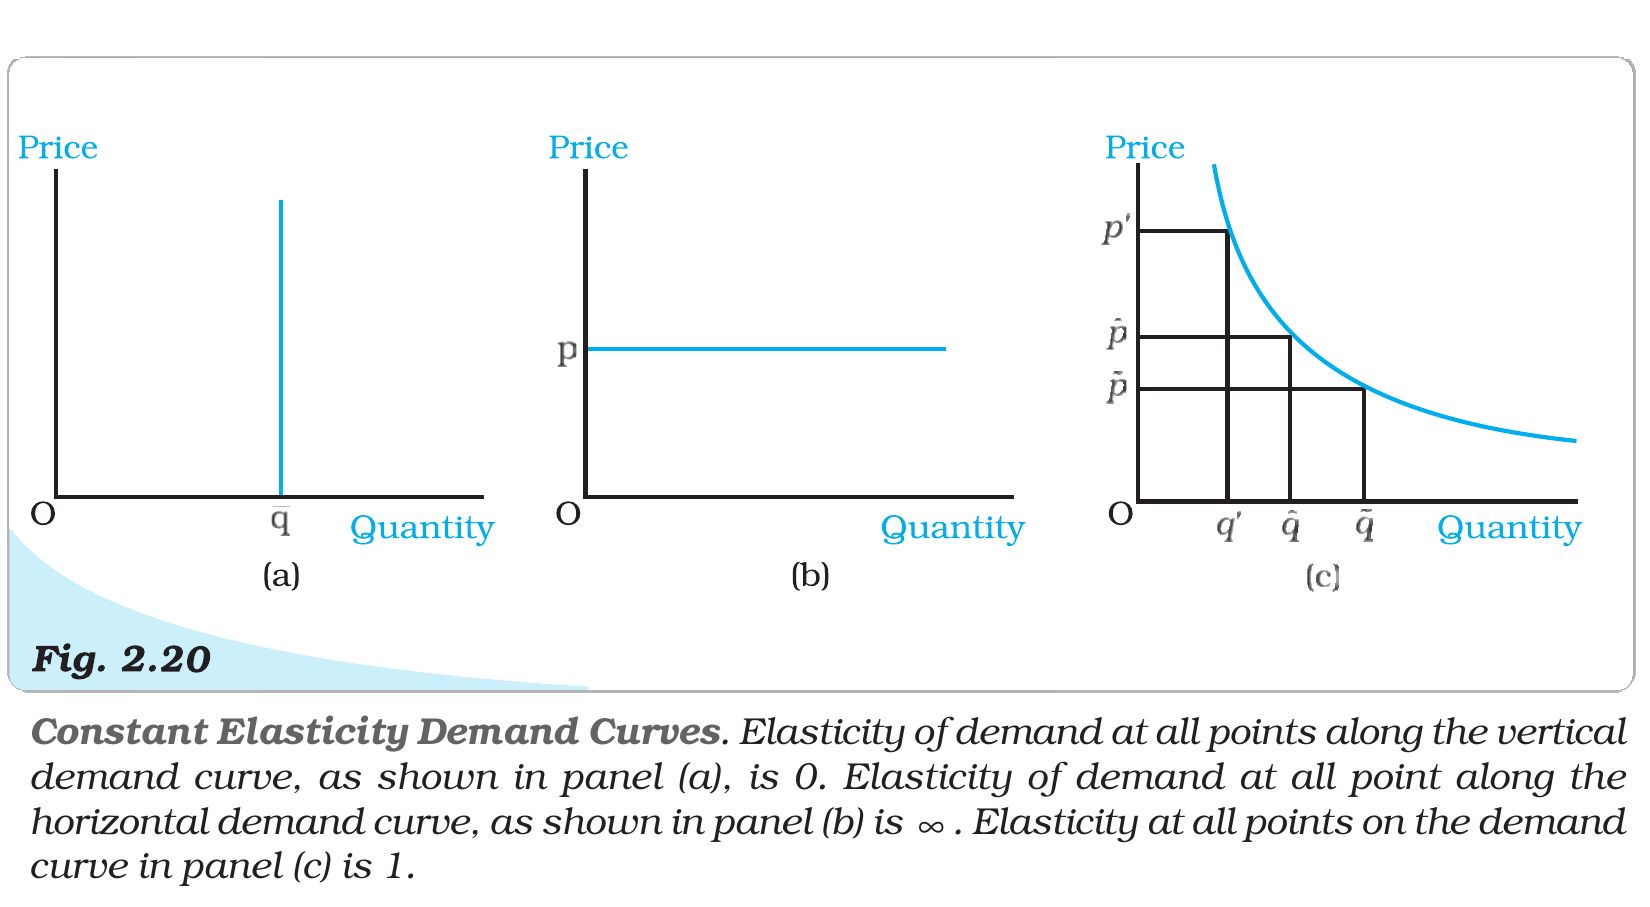
| (A) ed = ∞ | (III) Perfectly elastic | The demand curve is horizontal, and elasticity is infinite at every point. |
| (B) ed = 0 | (IV) Perfectly inelastic | The demand curve is vertical. The quantity does not respond to price at all. |
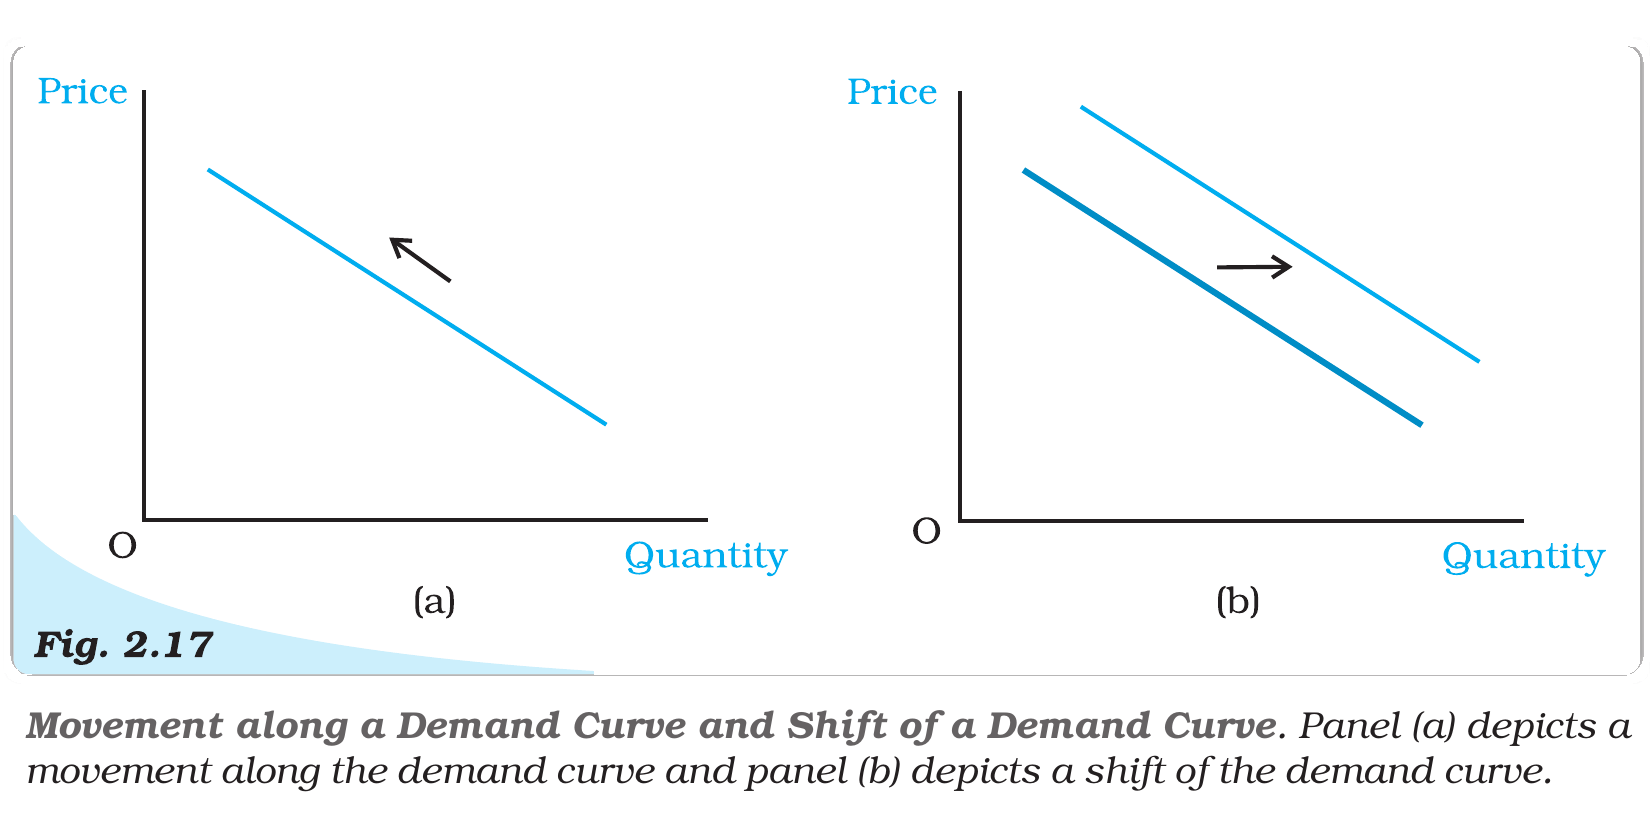
| (C) The diagram at (C) in List-I | (II) Movement along the curve | The arrow runs along the same curve D. Only the good’s own price has changed. |
| (D) The diagram at (D) in List-I | (I) Shift in the curve | The whole curve moves from D to D′, because something other than the good’s own price has changed. |
NCERT (2026-27): “Constant Elasticity Demand Curve … Consider, for example, a vertical demand curve as the one depicted in Figure 2.20(a). Whatever be the price, the demand is given at the level q. A price never leads to a change in the demand for such a demand curve and |eD| is always 0. Therefore, a vertical demand curve is perfectly inelastic. Figure 2.20 (b) depics a horizontal demand curve, where market price remains constant at P, whatever be the level of demand for the commodity. At any other price, quantity demanded drops to zero and therefore ed = ∞ . A horizontal demand curve is perfectly elastic. 2.4.6 Movements along the Demand Curve and Shifts in the Demand Curve … The demand curve is a graphical representation of the demand function. At higher prices, the demand is less, and at lower prices, the demand is more. Thus, any change in the price leads to movements along the demand curve. On the other hand, changes in any of the other things lead to a shift in the demand curve. Figure 2.17 illustrates a movement along the demand curve and a shift in the demand curve.”
|