
Study the graph below, which shows the consumption line CC′ and the saving line SS′, and answer the questions that follow.
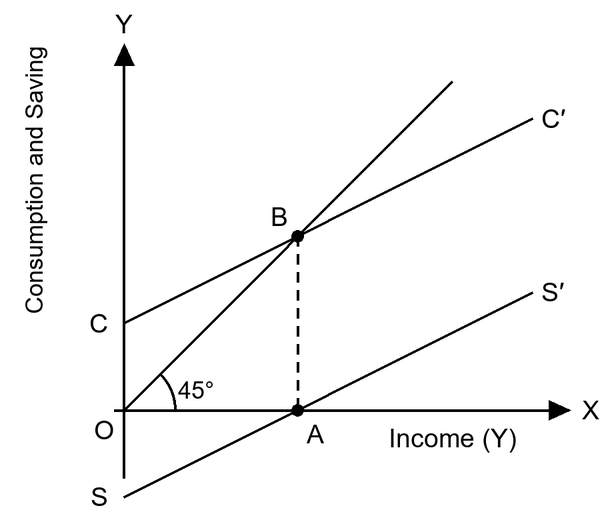
What will be the value of APS at point A?
Answer & explanation
Correct answer: option 1
The correct answer is Option (1) → Zero
At point A the saving line cuts the income axis, so saving is zero. APS = S / Y = 0 / Y = 0.
NCERT (2026-27): “4.1.1 Consumption … Let us also look at another dimension of this, savings. Savings is that part of income that is not consumed. … We define the marginal propensity to save (MPS) as the rate of change in savings as income increases. …” “Some Definitions Average propensity to save (APS): it is the savings per unit of income i.e., S/Y.” |