CUET Preparation Today
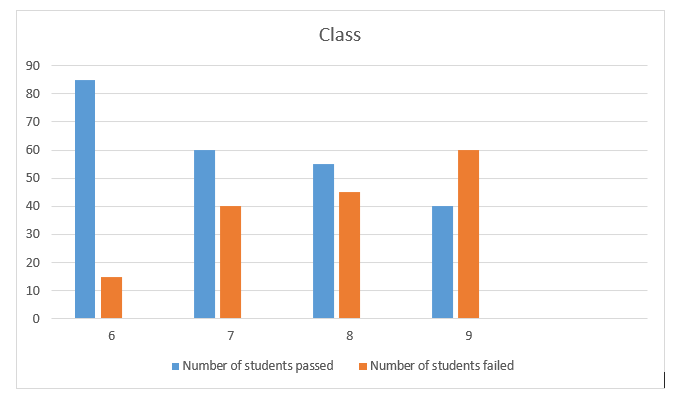
The bar graph shows the number of students who passed and failed in different classes in a school. If the total number of students in each class is 100, find the percentage of students who passed the exam.
|
25% 65% 60% 55% |
60% |
Percentage of students who passed the exam = $\frac{Number\;of\;students\; who\; passed}{Total\;number\;of\;students}$ Number of students who passed = 85 + 60+ 55 + 40 = 240 Total number of students in 4 classes = 400 ⇒ Percentage of students who passed the exam = \(\frac{240}{400}\) x 100 = 60% |