CUETMOCK
  • Pricing
  • Mentors
Log inStart freeStart free mocks→

First test, then trust

Try a free CUET mock test.

Join 5,00,000+ students who rehearsed exam day on the exact NTA screen before sitting CUET. On the web and on Android.

Start free mocks →Get the Android app
CUETMOCK

India's #1 CUET Mock Test Platform. Original NCERT-based questions on the exact NTA exam screen — trusted by 5,00,000+ students since CUET 2022.

Get it onGoogle PlayScan to download the CUETMOCK app

Mock tests

  • CUET mock test series
  • Browse all papers
  • Commerce mocks
  • Humanities (Arts) mocks
  • Science mocks
  • Languages & GAT mocks
  • Free practice questions
  • Pricing

Resources

  • CUET exam guide
  • CUET syllabus
  • Universities accepting CUET
  • Expert blogs
  • News & notifications
  • Webinars & counselling
  • CUET score calculator
  • How we estimate your rank
  • FAQs

Company

  • About us
  • Our leadership & team
  • Our toppers
  • Mentors
  • For schools
  • Contact us
  • Terms
  • Privacy
  • Refund policy

Talk to us

+91 7696 6630 56info@cuetmock.comWhatsApp us

Our other platforms

  • JEE Mock — For IIT-JEE aspirants
  • NEET Mock — For NEET aspirants

Newsletter

Exam updates, study material and offers — no spam.

© 2026 NYC Ventures Pvt. Ltd.

701-702, Royal Business Park, Zirakpur, Punjab - 140603

  • Terms of use
  • Privacy policy
  • Refund policy
  • Contact us

iCUETMOCK is an independent preparation platform, not affiliated with the National Testing Agency (NTA). Always check exam details on the official NTA website.

  • Home
  • Mock tests
  • CUET guide
  • Pricing
  • Log in
Home/Practice questions/Economics
EconomicsMicro Economics: Production and Costs

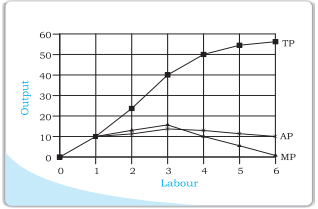
The following graph explains which of the following concepts?
The following graph explains which of the following concepts?

Answer & explanation+

Correct answer: option 3

The correct answer is Option (3) → Law of variable Proportions

The graph shows the marginal product of one input first rising and then falling while the other input is fixed. This is the law of variable proportions.

Option (1) Increasing Returns to Scale — Incorrect. Returns to scale need all inputs to rise together. Here only labour changes.

Option (2) Constant returns to scale — Incorrect. This too is about raising all inputs in the same proportion.

Option (3) Law of variable Proportions — Correct. The MP curve rises and then falls as labour is added to a fixed input.

Option (4) Cobb-Douglas Production Function — Incorrect. Cobb-Douglas is a form of production function, q = x1αx2β, not a graph of MP.

NCERT (2026-27): “3.4 The Law of Diminishing Marginal Product and the Law of Variable Proportions If we plot the data in table 3.2 on graph paper, placing labour on the X-axis and output on the Y-axis, we get the curves shown in the diagram below. Let us examine what is happening to TP. Notice that TP increases as labour input increases. But the rate at which it increases is not constant. An increase in labour from 1 to 2 increases TP by 10 units. An increase in labour from 2 to 3 increases TP by 12. The rate at which TP increases, as explained above, is shown by the MP. Notice that the MP first increases (upto 3 units of labour) and then begins to fall. This tendency of the MP to first increase and then fall is called the law of variable proportions or the law of diminishing marginal product. Law of variable proportions say that the marginal product of a factor input initially rises with its employment level. But after reaching a certain level of employment, it starts falling.”

NCERT extract

Advertisement

Practise more on Micro Economics: Production and Costs

Chapter-wise mocks on the real NTA exam screen, with solutions and your rank. Your first mocks are free.

Start free mocks →

Advertisement

Next questions

  1. Who is the author of the book "Knife"?General Aptitude Test · Current Affairs
  2. For the year 2017, with 2015 as base year, the quantity index (up to two decimals) is equal to: CommodityQuantity 2015Quantity 2017 P6065 Q…Applied Maths. Section B2 · Time Based Data
  3. Let vec a and vec b be two non-collinear unit vectors. If vec u = vec a -(vec a. vec b) vec b and vec v=vec a×vec b, then |vec v| isMaths. Section B1 · Vectors
  4. Choose the suitable Passive Voice sentence of the Active Voice sentence given below: "She has done her work." A. She was doing her workB. H…English · Grammar: Active Passive Voice
  5. Which of the following names can be given to a semiconductor containing electron rich impurities?Chemistry · Physical: Solid State
  6. Match the sentences in List-I with the figures of speech in List-II.List-I (Sentences)List-II (Figures of speech)(A) The new bakery in our…English · Figure of Speech
  7. Physics · Electromagnetic Induction
  8. Choose the correct option for the transformation of the given sentence into an exclamatory sentence : She is a wonderful woman.English · Kinds of Sentence
  9. Households receive factor payments for the services they render as employees of firms. Which of the following factor payments do these empl…Economics · Macro Economics: National Income Accounting
  10. Select the denotation of the highlighted word. His finicky attitude was the main cause of the conflict.English · Synonyms