
For a given LCR series circuit which of the following graph shows the variation of impedance (Z) with frequency (ν) of the source
Answer & explanation
Correct answer: option 2
The correct answer is Option (2)
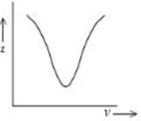
The impedance of a series LCR circuit is
\( \displaystyle Z = \sqrt{R^{2}+\left(2\pi\nu L-\frac{1}{2\pi\nu C}\right)^{2}} \)
At low frequency the capacitive reactance \( 1/2\pi\nu C \) is very large, so Z is large and falls as \( \nu \) rises. At the resonant frequency \( \nu_0 = \frac{1}{2\pi\sqrt{LC}} \) the reactances cancel and Z reaches its minimum value R, which is not zero. At high frequency the inductive reactance \( 2\pi\nu L \) dominates and Z rises again. The graph is a valley with its lowest point at \( \nu_0 \), as in Option (2).
Why the other options are incorrect
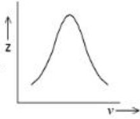
Option (1) — Incorrect. A peak at resonance is the shape of the current (or power) against frequency, not of the impedance, which is least there.
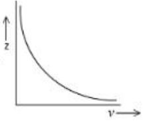
Option (3) — Incorrect. A steadily falling curve is \( Z = 1/2\pi\nu C \), the impedance of a capacitor alone; it ignores the inductor, whose reactance makes Z rise at high frequency.
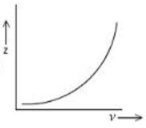
Option (4) — Incorrect. A steadily rising curve is \( Z = 2\pi\nu L \), the impedance of an inductor alone; it ignores the capacitor, which makes Z large at low frequency.
NCERT (2026-27):
Resonance – “… So if ω is varied, then at a particular frequency ω0, Xc = XL, and the impedance is minimum \( \left(Z = \sqrt{R^2 + 0^2} = R\right) \). … At resonant frequency, the current amplitude is maximum; im = vm/R.”