CUET Preparation Today
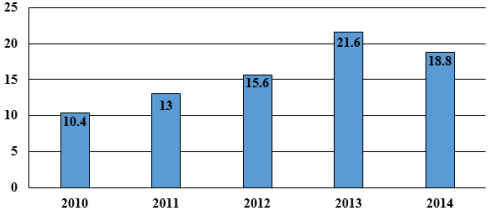
Study the given bar-graph and answer the question that follows. The bar-graph shows the exp011 of rice (in ₹ lakh) during five years.
In how many years was the export of rice less than the average export for the five-year period? |
4 1 3 2 |
3 |
Average export of Rice = \(\frac{10.4 + 13 + 15.6 + 21.6 + 18.8}{5}\) = \(\frac{ 79.4 }{5}\) = 15.88 So , Number of Years for which export is less than average export of rice over all years = 3 |