
CUETMOCK
  • Pricing
  • Mentors
Log inStart freeStart free mocks→

First test, then trust

Try a free CUET mock test.

Join 5,00,000+ students who rehearsed exam day on the exact NTA screen before sitting CUET. On the web and on Android.

Start free mocks →Get the Android app
CUETMOCK

India's #1 CUET Mock Test Platform. Original NCERT-based questions on the exact NTA exam screen — trusted by 5,00,000+ students since CUET 2022.

Get it onGoogle PlayScan to download the CUETMOCK app

Mock tests

  • CUET mock test series
  • Commerce mocks
  • Humanities (Arts) mocks
  • Science mocks
  • Languages & GAT mocks
  • Free practice questions
  • Pricing

Resources

  • CUET exam guide
  • CUET syllabus
  • Universities accepting CUET
  • Expert blogs
  • News & notifications
  • Webinars & counselling
  • CUET score calculator
  • How we estimate your rank
  • FAQs

Company

  • About us
  • Our leadership & team
  • Our toppers
  • Mentors
  • For schools
  • Contact us
  • Terms
  • Privacy
  • Refund policy

Talk to us

+91 7696 6630 56info@cuetmock.comWhatsApp us

Our other platforms

  • JEE Mock — For IIT-JEE aspirants
  • NEET Mock — For NEET aspirants

Newsletter

Exam updates, study material and offers — no spam.

© 2026 NYC Ventures Pvt. Ltd.

701-702, Royal Business Park, Zirakpur, Punjab - 140603

  • Terms of use
  • Privacy policy
  • Refund policy
  • Contact us

iCUETMOCK is an independent preparation platform, not affiliated with the National Testing Agency (NTA). Always check exam details on the official NTA website.

  • Home
  • Mock tests
  • CUET guide
  • Pricing
  • Log in
Home/Practice questions/Biology
BiologyOrganisms and Populations

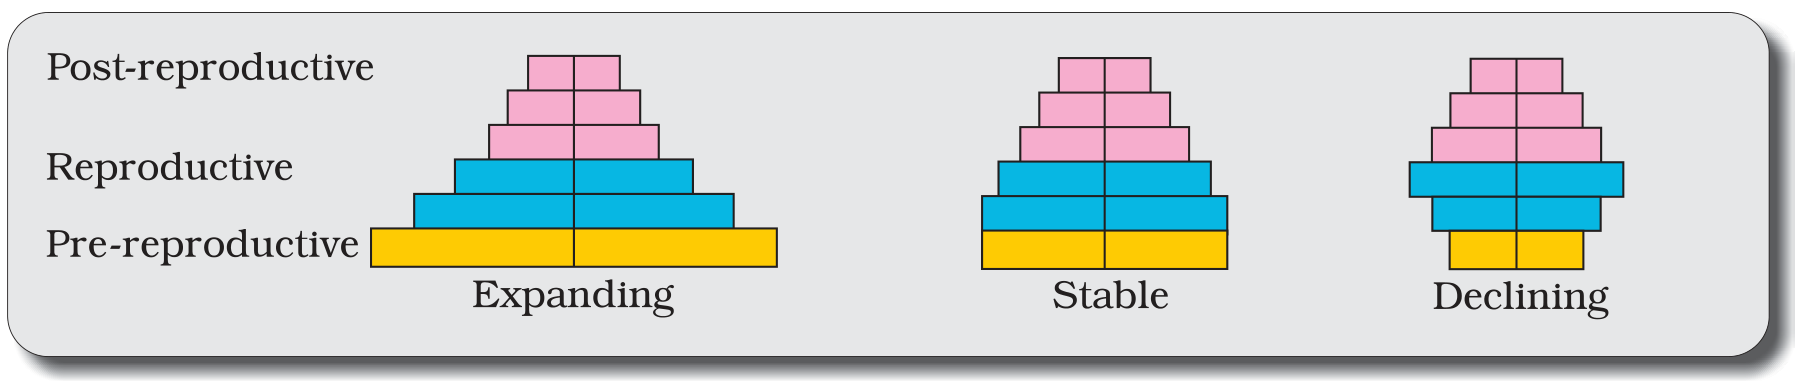
The figure shows three age pyramids, A, B and C, of human populations…

The figure shows three age pyramids, A, B and C, of human populations. Identify them.

Age pyramids A, B and C

Answer & explanation+

Correct answer: option 2

The correct answer is Option (2) → A - Stable, B - Expanding, C - Declining

An age pyramid is drawn by plotting the per cent of individuals in each age group (pre-reproductive, reproductive and post-reproductive). Its shape shows whether the population is growing, stable or declining.

A — Stable. The pre-reproductive and reproductive bands are almost the same width, with the sides narrowing only near the top. Young individuals just replace the adults, so the size stays about the same.

B — Expanding. The pre-reproductive band is the widest, and each band above it is narrower. A large young population will soon enter the reproductive age, so the population grows.

C — Declining. The pre-reproductive band is narrower than the reproductive band above it. Fewer young are coming up to replace the adults, so the population shrinks.

Note: Three little pyramids with their names rubbed off make a full question. Figures in NCERT are not decoration, so study every one as closely as the text beside it.

NCERT Extract:
Population Attributes – “… A population at any given time is composed of individuals of different ages. If the age distribution (per cent individuals of a given age or age group) is plotted for the population, the resulting structure is called an age pyramid (Figure 11.1). For human population, the age pyramids generally show age distribution of males and females in a diagram. The shape of the pyramids reflects the growth status of the population - (a) whether it is growing, (b) stable or (c) declining.”
Textbook figure

Figure 11.1 Representation of age pyramids for human population

Advertisement

Practise more on Organisms and Populations

Chapter-wise mocks on the real NTA exam screen, with solutions and your rank. Your first mocks are free.

Start free mocks →

Advertisement

Next questions

  1. Identify the noun clause in the following sentence:The fact that Kabir had cleared the driving test in his first attempt surprised his fath…English · Grammar: Clauses
  2. Lala Lajpat Rai is also known as :General Aptitude Test · General Knowledge
  3. Identify the option(s) with the correct synonym of the word "MELANCHOLY" : (A) Distasteful (B) Dejected (C) Dissemble (D) Depressed (E) Dis…English · Synonyms
  4. During the occurrence of thunder and lightning:General Aptitude Test · General Knowledge
  5. Find the length of the bridge which a train 130 m long travelling at 45 kmph can cross in 30 seconds, is :General Aptitude Test · Numerical Ability
  6. Select the set in which the numbers are related in the same way as are the numbers of the following set. 46, 92, 69General Aptitude Test · General Ability
  7. In a certain code ‘HOUSE’ is written as ‘KRUQC’. How is ‘SWIFT’ written in that code?General Aptitude Test · Verbal Reasoning
  8. On the marked price of an article, the sum of selling prices with a discount of 35% and two successive discounts of 20% and 15%, is ₹1,995.…General Aptitude Test · Numerical Ability
  9. Read the row of digits below from left to right. 7 5 8 5 6 5 7 2 2 9 1 8 5 9 8 5 4 9 4 8 5 8 2 4 How many 5s in this row have 8 directly be…General Aptitude Test · Verbal Reasoning
  10. From the following principles of management which combination has been given by the 'Father of General Management'. (A) Cooperation not Ind…Business Studies · Principles of Management