
CUETMOCK
  • Pricing
  • Mentors
Log inStart freeStart free mocks→

First test, then trust

Try a free CUET mock test.

Join 5,00,000+ students who rehearsed exam day on the exact NTA screen before sitting CUET. On the web and on Android.

Start free mocks →Get the Android app
CUETMOCK

India's #1 CUET Mock Test Platform. Original NCERT-based questions on the exact NTA exam screen — trusted by 5,00,000+ students since CUET 2022.

Get it onGoogle PlayScan to download the CUETMOCK app

Mock tests

  • CUET mock test series
  • Browse all papers
  • Commerce mocks
  • Humanities (Arts) mocks
  • Science mocks
  • Languages & GAT mocks
  • Free practice questions
  • Pricing

Resources

  • CUET exam guide
  • CUET syllabus
  • Universities accepting CUET
  • Expert blogs
  • News & notifications
  • Webinars & counselling
  • CUET score calculator
  • How we estimate your rank
  • FAQs

Company

  • About us
  • Our leadership & team
  • Our toppers
  • Mentors
  • For schools
  • Contact us
  • Terms
  • Privacy
  • Refund policy

Talk to us

+91 7696 6630 56info@cuetmock.comWhatsApp us

Our other platforms

  • JEE Mock — For IIT-JEE aspirants
  • NEET Mock — For NEET aspirants

Newsletter

Exam updates, study material and offers — no spam.

© 2026 NYC Ventures Pvt. Ltd.

701-702, Royal Business Park, Zirakpur, Punjab - 140603

  • Terms of use
  • Privacy policy
  • Refund policy
  • Contact us

iCUETMOCK is an independent preparation platform, not affiliated with the National Testing Agency (NTA). Always check exam details on the official NTA website.

  • Home
  • Mock tests
  • CUET guide
  • Pricing
  • Log in
Home/Practice questions/General Aptitude Test
General Aptitude TestQuantitative ReasoningData Interpretation & Stats

The line chart given below shows the population of two states P and Q…

The line chart given below shows the population of two states P and Q in 5 years.
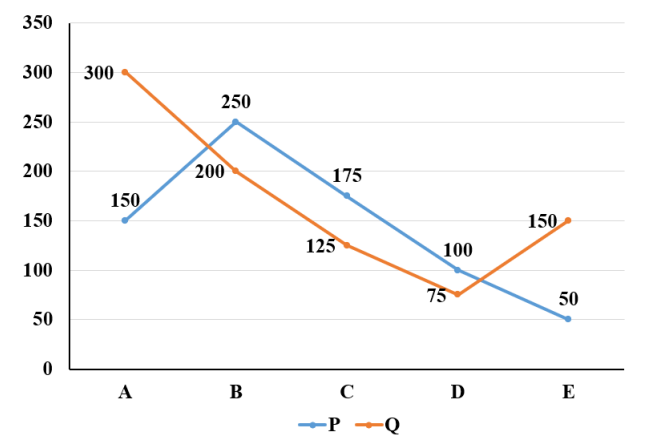
What is the difference between the population of two states P and Q in 5 years.


Answer & explanation+

Correct answer: option 2

Population of P in 5 years = 150 + 250 + 175 + 100 + 50 = 725

Population of Q in 5 years = 300 + 200 + 125 + 75 + 150 = 850

Difference b/w population of P & Q =  850 - 725 = 125

Advertisement

Practise more on Quantitative Reasoning

Chapter-wise mocks on the real NTA exam screen, with solutions and your rank. Your first mocks are free.

Start free mocks →

Advertisement

Next questions

  1. If a random variable X follows Poisson distribution such that 3P(X=1)=P(X=2) , then P(X=4) is,Applied Maths. Section B2 · Probability Distributions
  2. Three partners shared the profit of a business in the ratio 5 : 7 : 8. They kept their capital in the business for 14 months, 8 months and…General Aptitude Test · Numerical Ability
  3. Identify the correct statements about the definition of urban settlement in Indian context. (A) All places with at least 75 per cent of mal…Geography · India-People and Economy: Human Settlements
  4. If f(x) is twice differentiable function such that f(a)=0, f(b)=2, f(c)=-1, f(d)=2 and f(e)=0, where a<b<c<d<e, then the minimum number of…Maths. Section B1 · Continuity and Differentiability
  5. What is the value of x, if x% of 142 + 30% of 280 = 368?General Aptitude Test · Numerical Ability
  6. Established in 1867 at Bombay, the _______ sought to remove caste restrictions, abolish child marriage, and encourage the education of wome…General Aptitude Test · General Knowledge
  7. The journal entry for realisation of an unrecorded asset of ₹5,500 is:Accountancy Part A · Dissolution of Partnership Firm
  8. What are the problems of this Commonsensical social map?Sociology · Indian Society: Introducing Indian Society
  9. Which of the following is a pair of viral diseases?Biology · Human Health and Disease
  10. निम्नलिखित में से किस वाक्य में क्रिया वर्तमान काल में है?Hindi · व्याकरण - सकाल