CUET Preparation Today
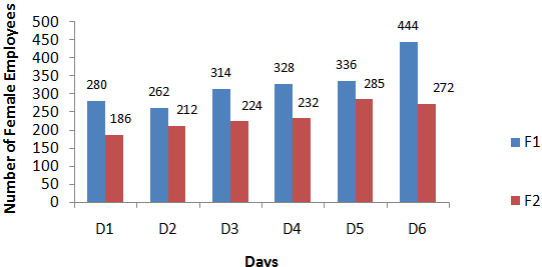
The Bar graph given below presents the number of female employees working in two factories on six different days of a week.
On which day the number of female workers in the factories F1 and F2, taken together, is the second highest? |
D5 D3 D4 D6 |
D5 |
Lets solve one by one for each option , 1. D5 F1 + F2 = 336 + 285 = 621 2. D3 F1 + F2 = 314 + 224 = 538 3. D4 F1 + F2 = 328 + 232 = 560 4. D6 F1 + F2 = 444 + 272 = 716 So , Second highest value of sum of F1 & F2 is on D5. |