CUET Preparation Today
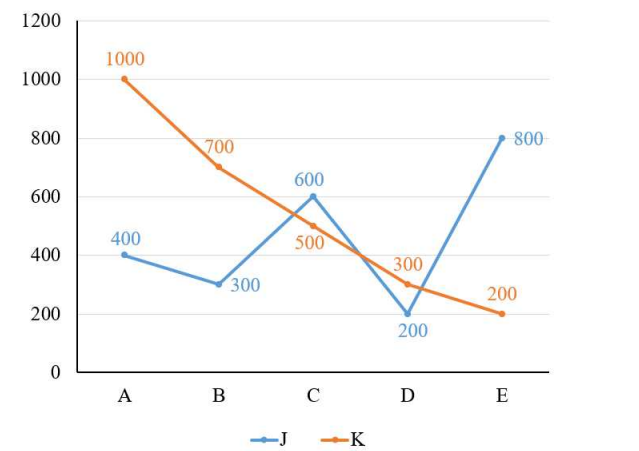
The line chart given below shows the expenditure of two companies J and K in five different years.
L1 - The difference between average expenditure of company J in year A and B and the average expenditure of company K in year C and D. L2 - The value of average expenditure of company K in all 5 years. What is the value of (L2 - L1)? |
540 420 490 350 |
490 |
L1 - The difference between average expenditure of company J in year A and B and the average expenditure of company K in year C and D. Average expenditure of J in year A & B = \(\frac{400 + 300 }{2}\) = 350 Average expenditure of K in year C & D = \(\frac{500 + 300 }{2}\) = 400 L1 = 400 - 350 = 50 L2 - The value of average expenditure of company K in all 5 years. L2 = \(\frac{1000 + 700 + 500 +300 + 200 }{5}\) = \(\frac{2700 }{5}\) = 540 Now , ( L2 - L1 ) = 540 - 50 = 490 |