
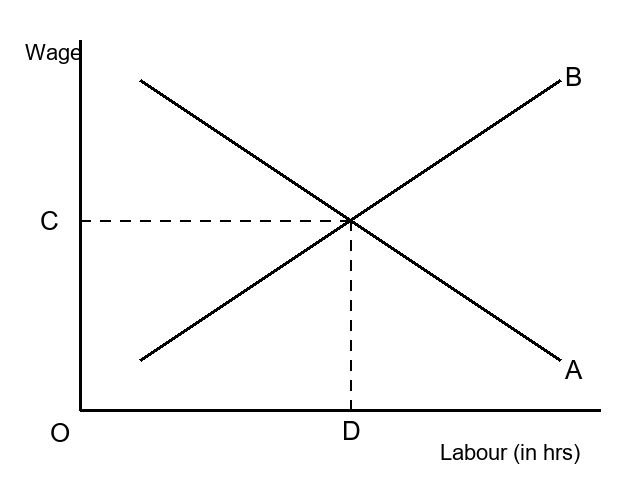
The figure shows a perfectly competitive labour market, with the wage rate on the vertical axis and labour (in hours) on the horizontal axis. Identify the parts labelled A, B, C and D.
Answer & explanation
Correct answer: option 2
The correct answer is Option (2) → A – Labour demand curve, B – Labour supply curve, C – Equilibrium wage, D – Equilibrium hours of labour
Firms hire less labour at a higher wage, so the labour demand curve slopes down: that is A. More individuals offer work at a higher wage, so the market supply curve slopes up: that is B.
The curves cross at the equilibrium. C, on the wage axis, is the equilibrium wage, and D, on the labour axis, is the equilibrium hours of labour.
NCERT (2026-27): “Wage Determination in Labour Market … To arrive at the market demand curve from individual firms’ demand curve, we simply add up the demand for labour by individual firms at different wages and since each firm demands less labour as wage increases, the market demand curve is also downward sloping.” “Wage Determination in Labour Market … Nevertheless, the market supply curve of labour, which we obtain by aggregating individuals’ supply at different wages, will be upward sloping because though at higher wages some individuals may be willing to work less, many more individuals will be attracted to supply more labour.” “Wage Determination in Labour Market … With an upward sloping supply curve and downward sloping demand curve, the equilibrium wage rate is determined at the point where these two curves intersect; in other words, where the labour that the households wish to supply is equal to the labour that the firms wish to hire. This is shown in the diagram.” |