
The two plots in the figure are drawn for the same first order reaction, R → P.
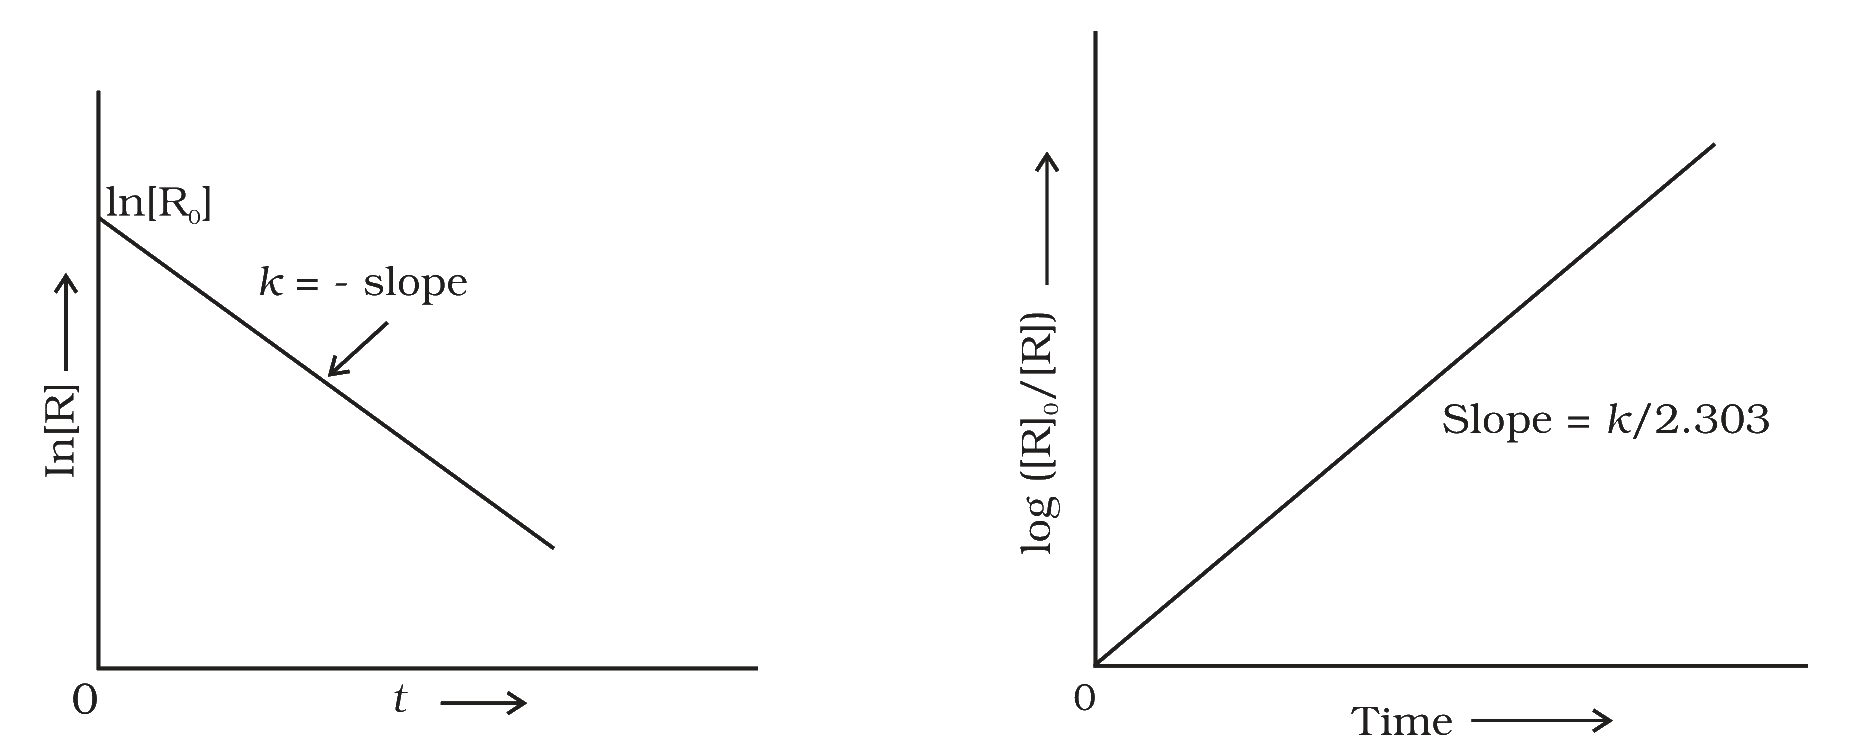
For this reaction, the slope of the ln[R] against t plot is −2.303 × 10⁻³ s−1. What is the slope of the log([R]0/[R]) against time plot?
Answer & explanation
Correct answer: option 3
The correct answer is Option (3) → 1.0 × 10⁻³ s−1
The first plot is marked k = −slope and the second is marked slope = k/2.303. So k is found from the first plot and then divided by 2.303. The second line rises with time, so its slope is positive.
\( \displaystyle k = -\text{slope} = -(-2.303 \times 10^{-3}\ \mathrm{s^{-1}}) = 2.303 \times 10^{-3}\ \mathrm{s^{-1}} \)
\( \displaystyle \text{slope of the log plot} = \frac{k}{2.303} = \frac{2.303 \times 10^{-3}\ \mathrm{s^{-1}}}{2.303} = 1.0 \times 10^{-3}\ \mathrm{s^{-1}} \)
NCERT (2026-27 edition):
3.3.2 First Order Reactions – “Comparing equation (3.9) with y = mx + c, if we plot ln [R] against t (Fig. 3.4) we get a straight line with slope = –k and intercept equal to ln [R]0”
“If we plot a graph between log [R]0/[R] vs t, (Fig. 3.5), the slope = k/2.303”
Fig. 3.4: A plot between ln[R] and t for a first order reaction; Fig. 3.5: Plot of log [R]0/[R] vs time for a first order reaction