
Statement I: For a zero order reaction, a plot of the concentration of the reactant against time is a straight line.
Statement II: For a zero order reaction, the rate of change of concentration with time remains constant.
Answer & explanation
Correct answer: option 1
The correct answer is Option (1) → Both Statement I and Statement II are correct and Statement II is the correct explanation of Statement I
In a zero order reaction the rate does not depend on the concentration of the reactant: Rate = k[R]0 = k.
Statement I: For a zero order reaction, a plot of the concentration of the reactant against time is a straight line. — True. The integrated rate equation is [R] = −kt + [R]0, which has the form y = mx + c, so [R] against t is a straight line of slope −k and intercept [R]0.
Statement II: For a zero order reaction, the rate of change of concentration with time remains constant. — True. −d[R]/dt = k, a constant, whatever the concentration.
Why Statement II explains Statement I?
The slope of a concentration–time graph is d[R]/dt.
Because this rate of change is the same at every moment (Statement II), the slope never changes and the graph is a straight line (Statement I).
NCERT (2026-27 edition):
3.3.1 Zero Order Reactions – “Zero order reaction means that the rate of the reaction is proportional to zero power of the concentration of reactants. Consider the reaction, R → P
\( \displaystyle \mathrm{Rate}=-\frac{d[\mathrm{R}]}{dt}=k[\mathrm{R}]^0 \)
…
\( \displaystyle [\mathrm{R}]=-kt+[\mathrm{R}]_0 \qquad (3.6) \)
Comparing (3.6) with equation of a straight line, y = mx + c, if we plot [R] against t, we get a straight line (Fig. 3.3) with slope = –k and intercept equal to [R]0.”
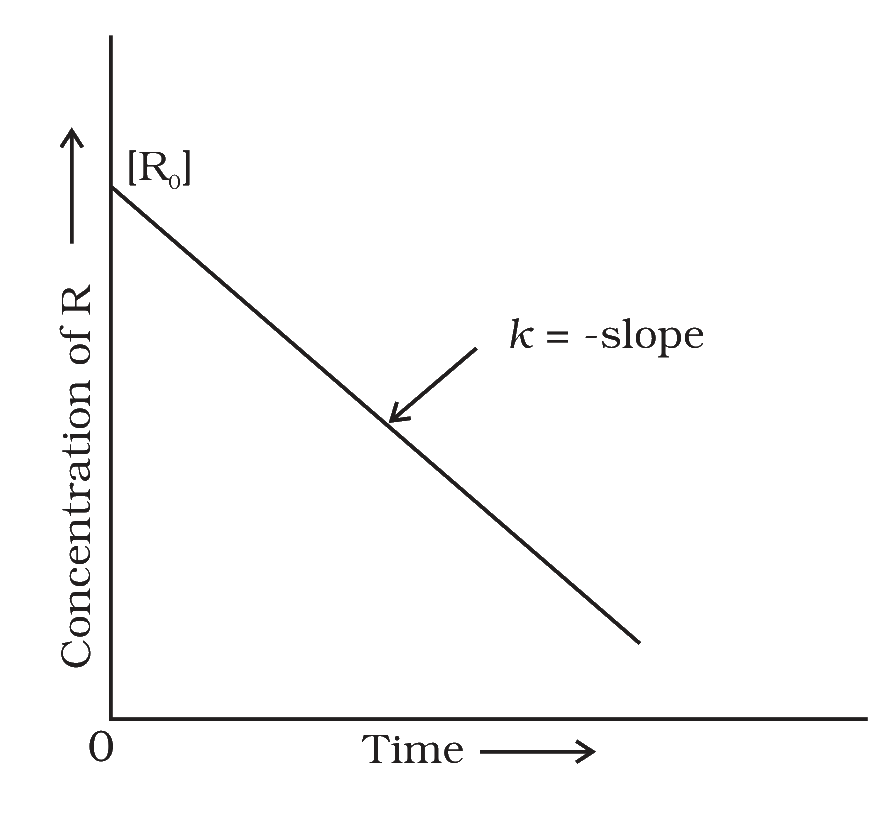
Fig. 3.3: Variation in the concentration vs time plot for a zero order reaction