The variation of ln k vs 1/T is indicated by
Answer & explanation
Correct answer: option 2
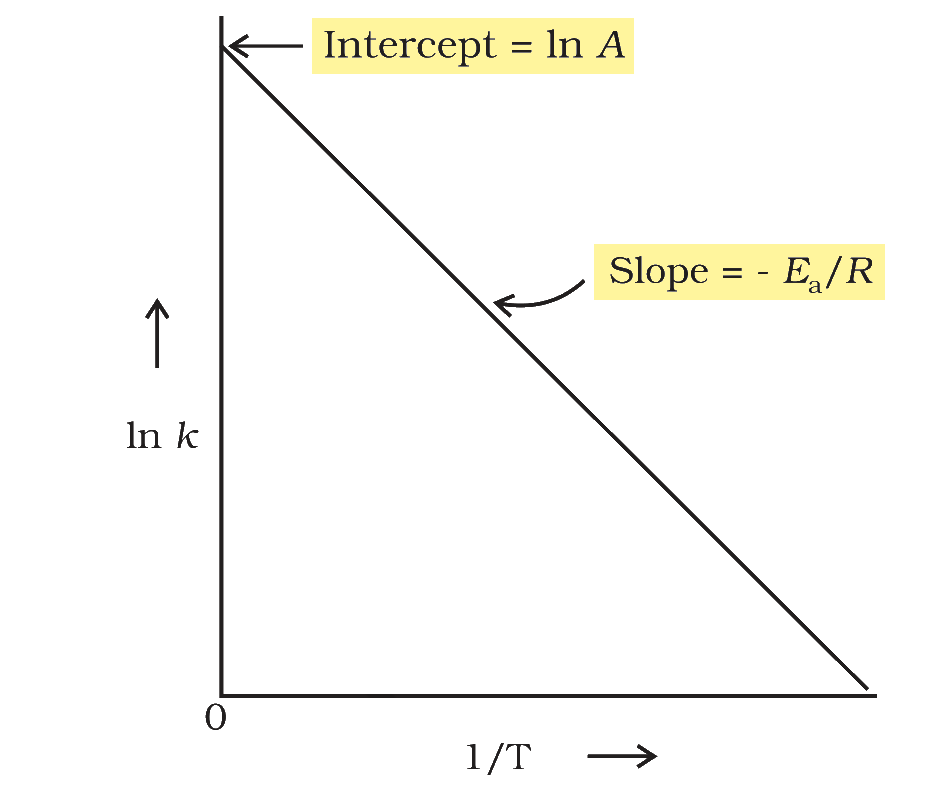
The correct answer is Option (2) → a straight line with a negative slope and a positive intercept
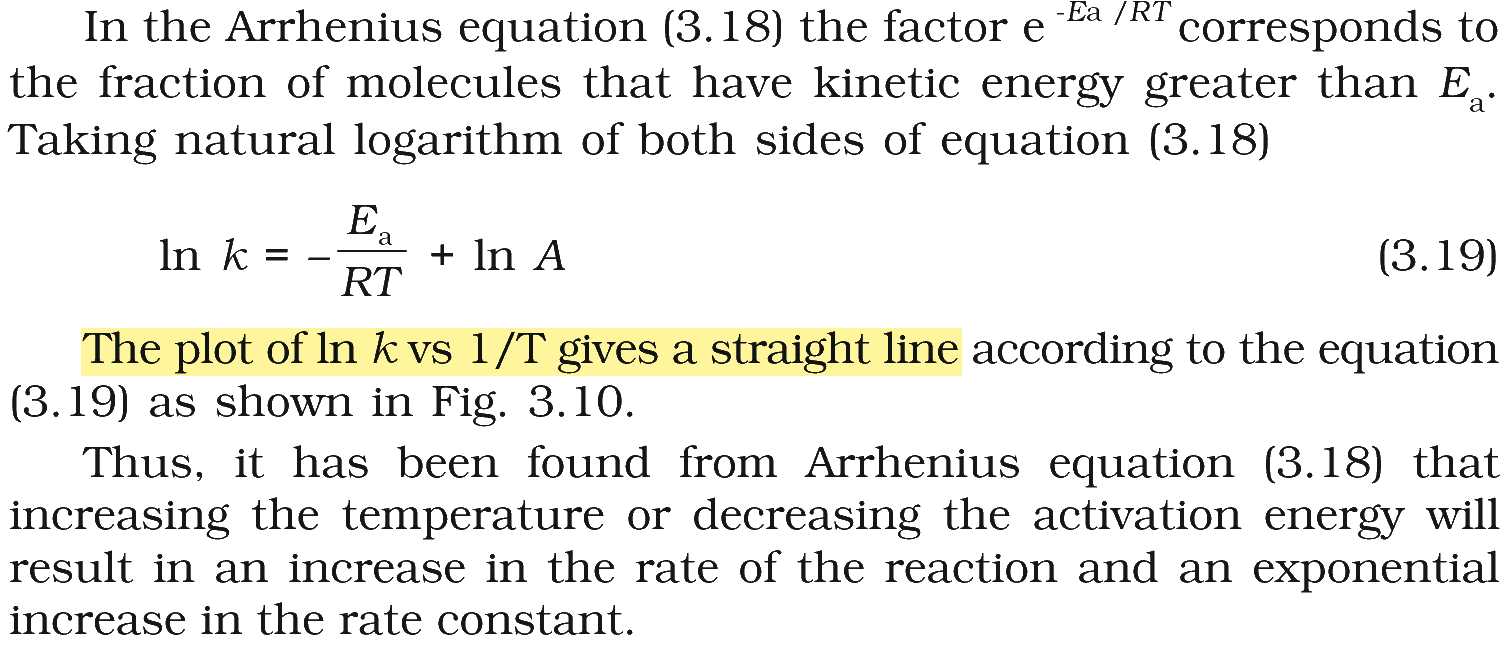
The dependence of the rate constant on temperature is given by the Arrhenius equation:
\( \displaystyle k=A\,e^{-E_a/RT} \)
Taking natural logarithms on both sides:
\( \displaystyle \ln k=\ln A-\frac{E_a}{R}\left(\frac{1}{T}\right) \)
This has the form of a straight line, y = c + mx, with:
y = ln k and x = 1/T,
slope m = −Ea/R, which is negative because Ea and R are positive,
intercept c = ln A on the ln k axis.
So the plot of ln k against 1/T is a straight line sloping downwards, as in Option (2). A steeper slope means a larger activation energy.
Why the other options are incorrect
Option (1) — Incorrect. A rising line through the origin would mean k decreases as temperature increases, and ln k would be zero when 1/T is zero.
Option (3) — Incorrect. A horizontal line would mean k does not change with temperature, which happens only if Ea = 0.
Option (4) — Incorrect. A rising line has a positive slope, which would need a negative activation energy.
NCERT (2026-27 edition):
Temperature Dependence of the Rate of a Reaction – …