
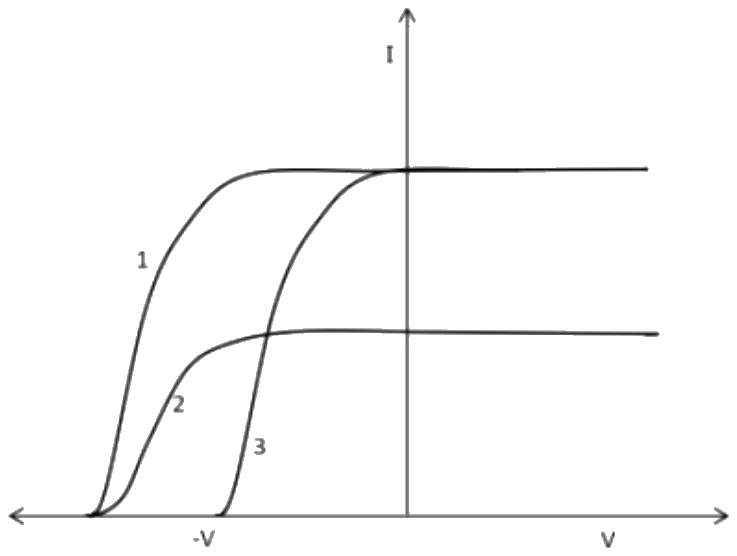
In the context of photoelectric effect, three curves (labelled \( 1 \), \( 2 \) and \( 3 \)) as shown in figure, represent the variation of photocurrent \( (I) \) and collector plate potential \( (V) \) for two different materials using different intensities of a monochromatic light. Which of the following curves represent the same material?
Answer & explanation
Correct answer: option 3
The correct answer is Option (3) → \( 1 \) and \( 2 \) only
In the photoelectric effect the stopping potential depends only on the material (its work function) and the frequency of the light, while the saturation current depends on the intensity. Here the light is monochromatic, so curves with the same stopping potential belong to the same material.
Readings from the graph:
Curves 1 and 2 cut the \( V \)-axis at the same negative potential, so they have the same stopping potential; their saturation currents differ, so they were taken at different intensities.
Curve 3 cuts the axis at a smaller stopping potential \( (-V) \), so it belongs to the other material, even though its saturation current equals that of curve 1.
So curves 1 and 2 represent the same material.
NCERT (2026-27):
Effect of Potential on Photoelectric Current – “… This shows that more electrons are being emitted per second, proportional to the intensity of incident radiation.”
Effect of Potential on Photoelectric Current – “… Thus, for a given frequency of the incident radiation, the stopping potential is independent of its intensity. In other words, the maximum kinetic energy of photoelectrons depends on the light source and the emitter plate material, but is independent of intensity of incident radiation.”