CUET Preparation Today
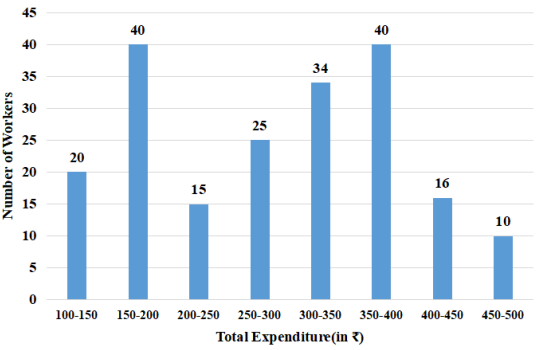
The following histogram represents the distribution of total household expenditure (in ₹) of 200 manual workers in a city.
The number of workers whose total expenditure is ₹350 and above is what percentage less than the number of workers whose total expenditure is less than ₹250? |
15% 12% 14% 10% |
12% |
Number of workers with total expenditure is ₹350 and above = 40 + 16 + 10 =66 Number of workers whose total expenditure is less than ₹250 = 20 + 40 + 15 = 75 Required percentage = \(\frac{75-66 }{75}\) × 100 = \(\frac{9 }{3}\) × 4 = 12% |