CUET Preparation Today
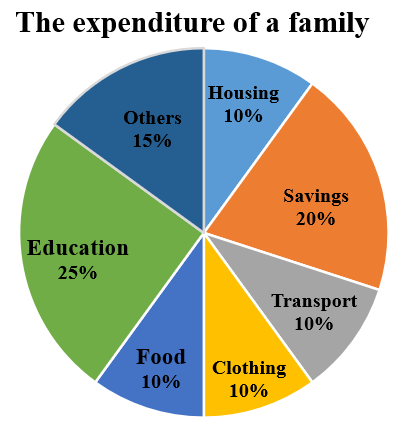
The pie chart below shows the expenditure of a family percentage during a certain year. If the total amount spent during the year is Rs. 3,00,000. On which of the following items, amount spent together is equal to Rs. 1,50,000.
|
Education, Others, Savings Transport, Other , Education Savings, Housing, Education Savings, Clothing, Education |
Transport, Other , Education |
By observing all options one by one 1. Education, Others, Savings = 25% + 15% + 20% = 60% 2. Transport, Other , Education = 10% + 15% + 25% = 50% 3. Savings, Housing, Education = 20% + 10% + 25% = 55% 4. Savings, Clothing, Education = 20% + 10% + 25% = 55% So , In option 2 Transport, Other , Education amount spent together is 50% i.e. Rs.1,50,000. |