CUET Preparation Today
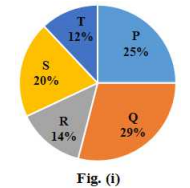
The given pie charts show the distribution of students of graduate and postgraduate levels in five different institutes. P,Q, R, S and T, in a town. Study the pie charts and answer the question that follows. (i) Total number of students of graduate level in five different institutes = 12400
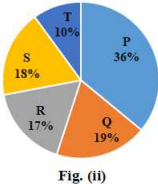
(ii) Total number of students of post graduate level in five different institutes = 8000
The number of students in graduate level in institute S is approximately what percentage more than the number of students in post graduate level in institute S? (correct to one decimal place) |
70.2% 72.2% 74.4% 62.2% |
72.2% |
Number of students in graduate level in institute S = \(\frac{20 }{100}\) × 12400 = \(\frac{1 }{5}\) × 12400 = 2480 Number of students in post graduate level in institute S = \(\frac{18 }{100}\) × 8000 = 1440 Required percentage = \(\frac{2480 - 1440 }{1440}\) × 100 = \(\frac{ 1040 }{1440}\) × 100 = 72.2%
|