CUET Preparation Today
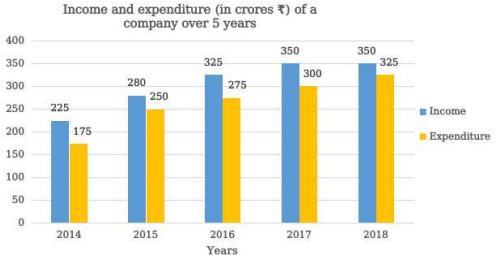
The given bar graph shows the income and expenditure (in crores 3) of a company over 5 years, from 2014 to 2018. Study the bar graph and answer the question that follows.
What is the difference (in crores ₹) between the expenditure for the years 2017 and 2018 taken together and the income for the years 2015 and 2016 taken together? |
15 20 18 16 |
20 |
Expenditure of 2017 & 2018 = 300 + 325 = 625 Income of 2015 & 2016 = 280 + 325 = 605 Required difference = 625 - 605 = 20 |