CUET Preparation Today
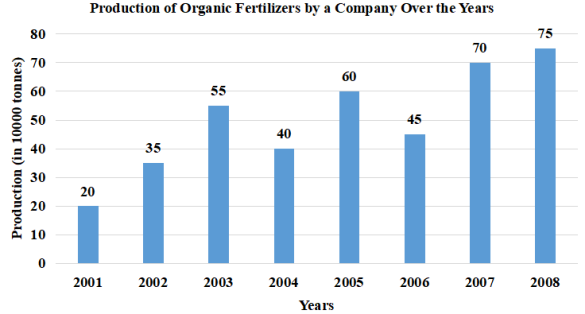
Study the given bar graph and answer the question that follows.
In which year was the percentage increase in production as compared to the previous year, the maximum? |
2002 2005 2007 2008 |
2002 |
Lets find out one by one for each option . 1. 2002 Percentage increase in production in 2002 as compared to the previous year = \(\frac{35-20 }{20}\) × 100 = \(\frac{15 }{20}\) × 100 = 75% 2. 2005 Percentage increase in production in 2002 as compared to the previous year = \(\frac{60-40 }{40}\) × 100 = \(\frac{20 }{40}\) × 100 = 50% 3. 2007 Percentage increase in production in 2002 as compared to the previous year = \(\frac{70-45 }{45}\) × 100 = \(\frac{25 }{45}\) × 100 = 55.5% 4. 2008 Percentage increase in production in 2002 as compared to the previous year = \(\frac{75-70 }{70}\) × 100 = \(\frac{5 }{70}\) × 100 = 7.14% So , Percentage increase in production as compared to the previous year is maximum in year 2002. Ans :- 2002 |