CUET Preparation Today
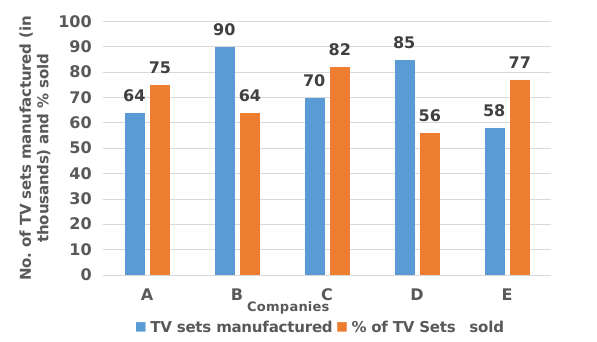
The given bar chart represents the Televisions Sets (TV) manufactured (in thousands ) and the respective percentage of those TV Sets sold by five different companies A, B, C, D and E in 2015. Study the chart carefully and answer the question that follows.
What is the ratio of the number TV sets sold by company A to that of company B in 2015 ?
|
6 : 5 4 : 5 5 : 4 5 : 6 |
5 : 6 |
75% = \(\frac{3}{4}\) & 64% = \(\frac{16}{25}\) TV sold by A : TV sold by B \(\frac{3}{4}\) × 64 : \(\frac{16}{25}\) × 90 5 : 6 |