CUET Preparation Today
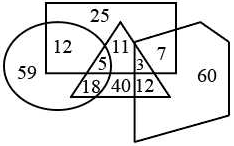
The data of a company’s employees is shown by the given Venn diagram. The circle represents ‘engineers’, the triangle represents computer experts’, the rectangle represents ‘MBAs’ and the pentagon represents ‘females’. The numbers given in the diagram represent the number of persons of that particular category.
How many of the employees are MBAs, and how many male MBAs are computer experts but NOT engineers, respectively? |
44, 11 63, 11 25, 18 44, 16 |
63, 11 |
The circle represents ‘engineers’ The triangle represents computer experts’ The rectangle represents ‘MBAs’ and The pentagon represents ‘females’.
Step 1 ) Look at the figure of rectangle and Triangle , circle and square respectively Step 2) Look at number given in employees are MBAs, and how many male MBAs are computer experts but NOT engineers, respectively Step 3) By visual observations we conclude that 63 are MBAs and 11 male MBAs are computer experts but NOT engineers, respectively |