CUET Preparation Today
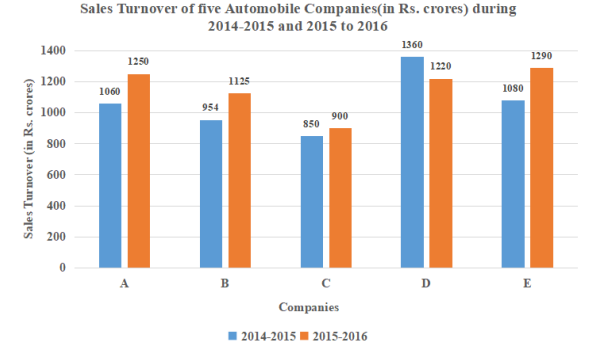
Study the given bar graph and answer the question that follows. The given bar graph represents the Sales Turnover (in 2 crore) of five automobile companies A. B, C, D and E during 2014-2015 and 2015-2016. The X-axis represents the Companies. and the Y-axis shows the Sales Turnover (in ₹ crore). (The data shown here is only for mathematical exercise. They do not represent the actual figures of the company.)
What should have been the sales turnover (in 2 crore) of Company C in 2015-2016 to have shown the same increase in its sales over 2014-2015 as shown by the sales turnover of Company E? |
1,060 1,110 1,050 1,290 |
1,060 |
Sales turnover of company C in 2014-2015 = 850 Sales turnover of company E in 2015 - 2016 in respect of 2014 - 2015 = 1290 - 1080 = 210 So , Turnover of company C in 2015 - 2016 = 850 + 210 = 1060 crore |