CUET Preparation Today
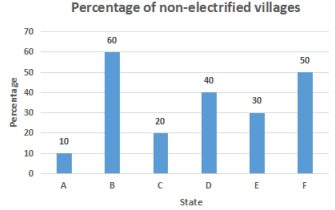
The given bar graph represents the Percentage of non-electrified villages in 6 states A, B, C, D, E and F. Study the graph and answer the question that follows.
How many states have at most 30% or less non-electrified villages? |
3 4 1 2 |
3 |
By carefully observing the table . We find that Percentage of non-electrified village in A = 10% Percentage of non-electrified village in C = 20% Percentage of non-electrified village in E = 30% So , State A , C & E have at most 30% or less non-electrified villages. Ans :- 3 |