CUET Preparation Today
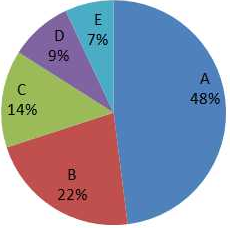
The given pie-chart represents the distribution of the percentage of sales of a particular brand of car from five showrooms A, B, C, D and E during 2018. The total number of cars sold during that year from the five showrooms is 5000.
What is the total number of cars sold from the show rooms B and D? |
1650 1450 1750 1550 |
1550 |
Number of cars sold from B & D = \(\frac{22 + 9}{100}\) × 5000 = \(\frac{31}{100}\) × 5000 = 1550 |