CUET Preparation Today
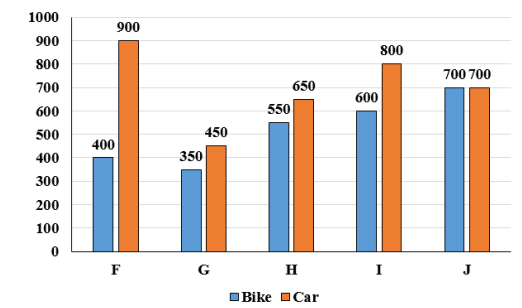
The bar graph given below shows the sales of bikes and cars of five companies.
P1 = The difference between the average sales of bikes and average sales of cars of all 5 companies. P2 = The total value of the sales of bikes and cars of all 5 companies. What is the value of (P2 - P1)? |
5320 4926 6100 5920 |
5920 |
P1 = The difference between the average sales of bikes and average sales of cars of all 5 companies. Average sale of Bikes = \(\frac{400 + 350 + 550 + 600 + 700}{5}\) = \(\frac{ 2600}{5}\) = 520 Average sale of Cars = \(\frac{900 + 450 + 650 + 800 + 700}{5}\) = \(\frac{3500}{5}\) = 700 P1 = 700 - 520 = 180 P2 = The total value of the sales of bikes and cars of all 5 companies = 2600 + 3500 = 6100 Now , ( P2 - P1 ) = 6100 - 180 = 5920 |