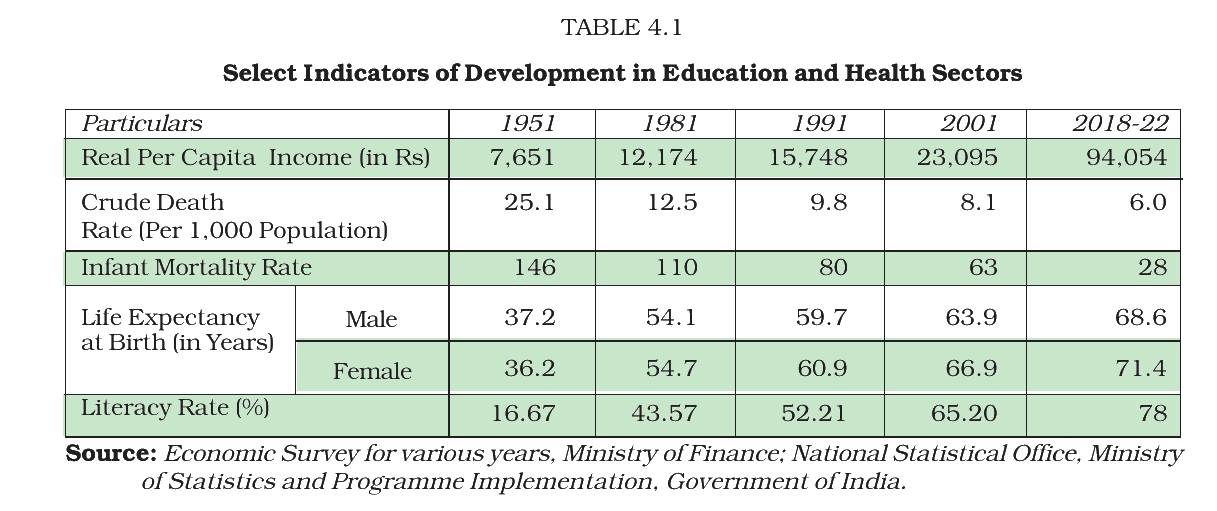
Read the following figures for India:
| Indicator | 1951 | 2018–22 |
|---|---|---|
| Real per capita income (Rs) | 7,651 | 94,054 |
| Infant mortality rate | 146 | 28 |
| Life expectancy at birth, female (years) | 36.2 | 71.4 |
| Literacy rate (%) | 16.67 | 78 |
Which of the following conclusions is correct?
Answer & explanation
Correct answer: option 3
The correct answer is Option (3) → Education, health and income grew together, and growth in each has probably reinforced the others.
All four indicators improved between 1951 and 2018-22. Income, literacy and life expectancy rose, and infant mortality fell. These sectors grew together, but the figures cannot prove cause and effect.
Option (1) The figures prove that the rise in the literacy rate caused the rise in real per capita income. — Incorrect. It is difficult to establish a cause-and-effect link from human capital to growth.
Option (2) Real per capita income rose about four times, much less than the rise in the literacy rate. — Incorrect. Income rose about 12 times (7,651 to 94,054). Literacy rose about 4.7 times (16.67 to 78).
Option (3) Education, health and income grew together, and growth in each has probably reinforced the others. — Correct. The sectors grew simultaneously.
Option (4) Health improved, but real per capita income in 2018–22 was below its 1951 level. — Incorrect. Income in 2018-22 (94,054) was far above 1951 (7,651).
NCERT (2026-27): “Human Capital and Economic Growth: … It is difficult to establish a relation of cause and effect from the growth of human capital (education and health) to economic growth but we can see in Table 4.1 that these sectors have grown simultaneously. Growth in each sector probably has reinforced the growth of every other sector.”
|