CUET Preparation Today
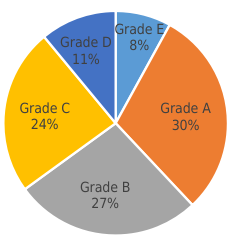
Performance of 1800 students has been shown in the following pie chart. In which two grades taken together is the number of students 54 less than the number of students in grades B and E taken together ?
|
C and E B and D A and E C and D |
C and E |
Number of students in B & E = \(\frac{27 + 8 }{100}\) × 1800 = \(\frac{7}{20}\) × 1800 = 630 54 less than 630 = 630 - 54 = 576 Now Find 576 is how much percentage of 1800 = \(\frac{576 }{1800}\) × 100 = 32% Now , observing the chart Number of students in C & E together is 54 less than Number of students in B & E together . |