CUET Preparation Today
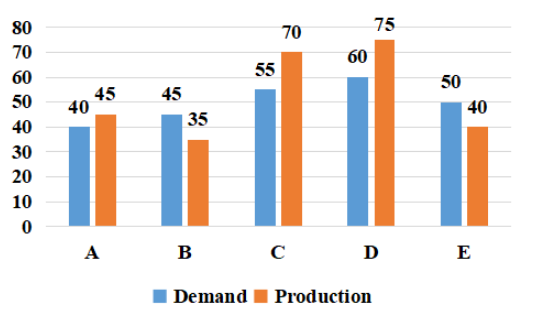
The following bar graph shows the demand and production (in Lakhs) of motor cycles of five different companies A, B, C, D and E in 2020.
What is the ratio of total production of motor cycles of companies A, B, C, D and E, to that of the total demand of motorcycles of all the companies during the five years? |
53 : 50 33 : 50 23 : 50 13 : 50 |
53 : 50 |
Total production : Total demand = ( 45 + 35 + 70 + 75 + 40) : (40 + 45 + 55 + 60 + 50) = 265 : 250 = 53 : 50 |