CUET Preparation Today
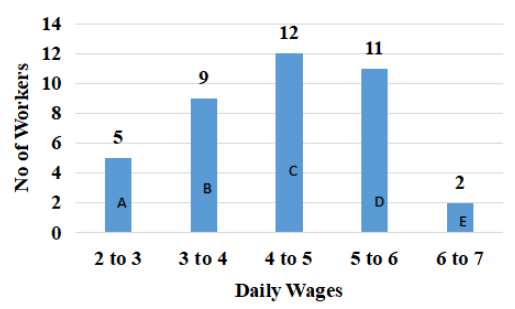
In factory there are 39 workers who have been categorized into five groups (A, B, C, D, E) on the basis of the range of their daily wages (in multiples of ₹100). The distribution is presented through a Histogram shown below:
What is the ratio of the number of employees whose daily wages are ₹200 or more but less than ₹400 to that of the number of employees whose daily wages are ₹400 or more but less than ₹600? |
41 : 23 23 : 41 14 : 23 23 : 14 |
14 : 23 |
Number of employee with daily wages b/w 200 to 400 and b/w 400 to 600 = ( 5 + 9 ) : ( 12 + 11 ) = 14 : 23 |