CUET Preparation Today
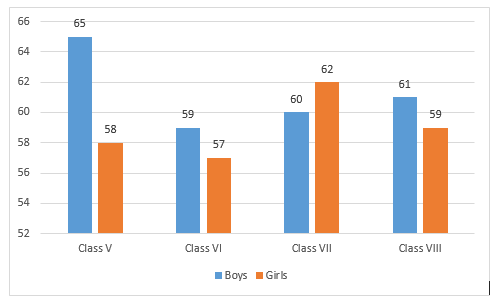
The following graph shows the number of boys and girls in Class V, Class VI, Class VII and Class VIII. Study the graph and answer the question.
In which class, the percentage increase in the number of boys as compared to its previous class is least ? |
Class VIII Class V Class VII Class VI |
Class VIII |
From class V to VI Number of boys decreased. From class VII , Percentage increase in number of boys = \(\frac{60-59 }{59}\) × 100 = \(\frac{1 }{59}\) × 100 = 1.69% From class VIII , Percentage increase in number of boys = \(\frac{61-60 }{60}\) × 100 = \(\frac{1 }{60}\) × 100 = 1.67% Percentage increase in number of boys is least for class VIII
|