
What is the equation describing the relationship between species richness (S) and area (A) on a logarithmic scale?
Answer & explanation
Correct answer: option 1
The correct answer is Option (1) → log S = log C + Z log A
Alexander von Humboldt found that the number of species in a region (species richness) rises as the explored area grows, but only up to a limit. On an ordinary graph this gives a curve (S = CAZ). When both values are taken on a logarithmic scale, the curve becomes a straight line: log S = log C + Z log A.
For most regions, Z lies between 0.1 and 0.2. For very large areas, such as whole continents, the line is much steeper (Z about 0.6 to 1.2).
NCERT Extract:
Patterns of Biodiversity – “… (ii) Species-Area relationships: During his pioneering and extensive explorations in the wilderness of South American jungles, the great German naturalist and geographer Alexander von Humboldt observed that within a region species richness increased with increasing explored area, but only up to a limit. In fact, the relation between species richness and area for a wide variety of taxa (angiosperm plants, birds, bats, freshwater fishes) turns out to be a rectangular hyperbola (Figure 13.2). On a logarithmic scale, the relationship is a straight line described by the equation
log S = log C + Z log A
where
S= Species richness
A= Area
Z = slope of the line (regression coefficient)
C = Y-intercept”
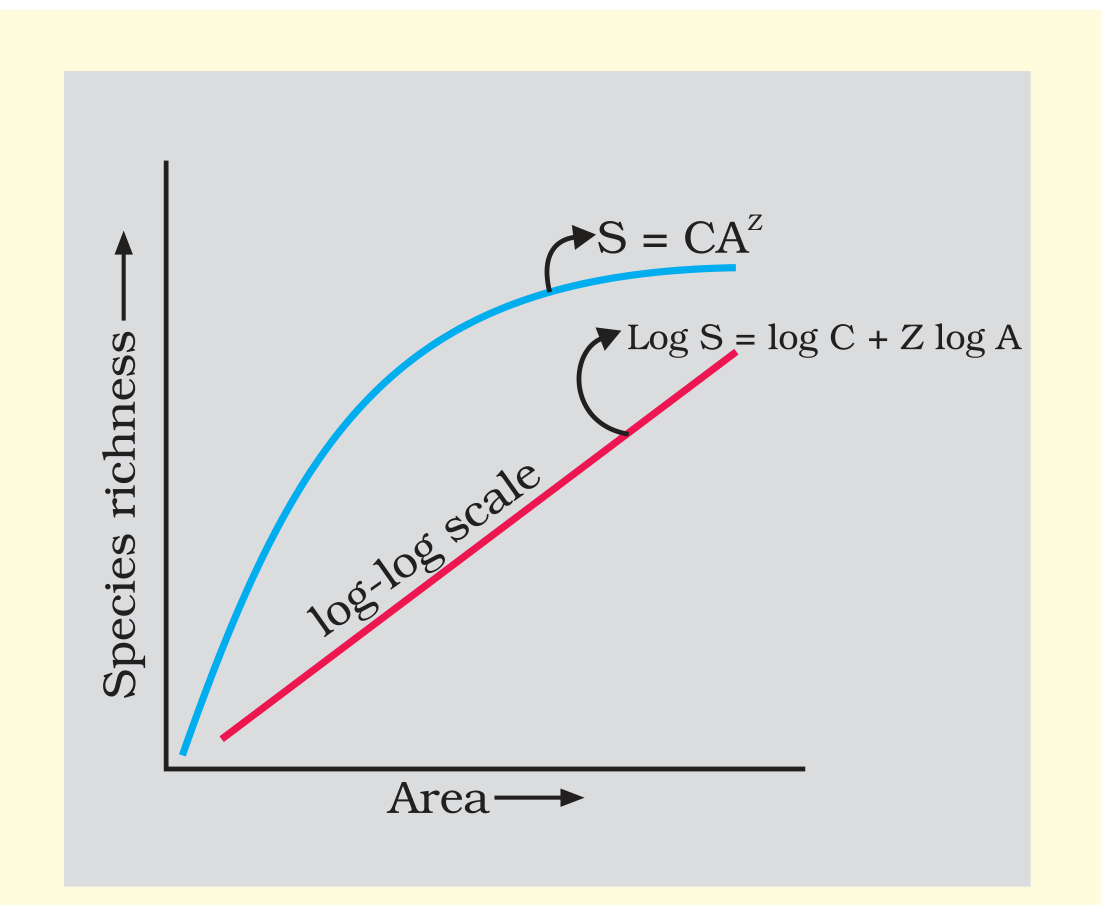
Figure 13.2 Showing species area relationship. Note that on log scale the relationship becomes linear