CUET Preparation Today
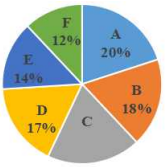
The following pie chart represents the percentage-wise distribution of 300 students of class X in a school in six different sections A, B, C, D, E and F.
The given table shows the number of boys of class X in six different sections A, B, C, D, E and F.
The total number of boys in sections A, B and D together is what percentage more than the total number of girls in sections A. B and D together? |
18% 30% 15% 20% |
20% |
Number of boys in section A , B & D = 36 + 26 + 28 = 90 Number of girls in A , B & D = Total number of students in A , B & D - Number of boys in section A , B & D Total number of students in all sections = 300 Total number of students in A , B & D = \(\frac{20+18+17 }{100}\) ×300 = \(\frac{ 55 }{100}\) ×300 = 165 Total number of girls = 165 - 90 = 75 Percentage of more boys in A , B & D than girls in A, B & D = \(\frac{ 90-75 }{75}\) × 100 = \(\frac{ 15 }{75}\) × 100 = 20% |