CUET Preparation Today
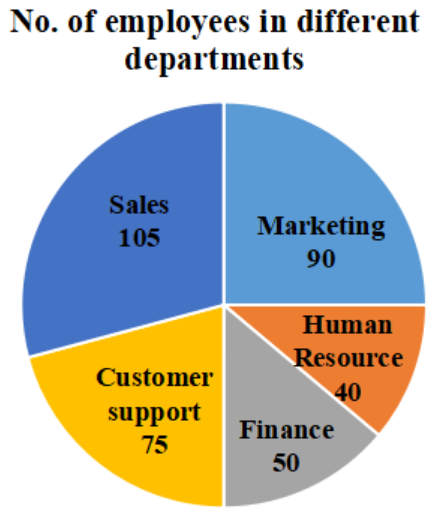
The following pie chart gives the central angles of the various sectors representing the number of employees in different departments in a company.
The number of employees in the marketing department is what percentage of the number of employees in all the departments taken together? |
50% 12.5% 20% 25% |
25% |
Number of employees in the marketing department = 90 Number of employees in all the departments = 105 + 90 + 40 + 50 + 75 = 360 Percentage of employees in marketing department = \(\frac{90 }{360}\) × 100 = 25% |