Practicing Success

Target Exam

CUET

Subject

General Test

Chapter

Quantitative Reasoning

Topic

Data Interpretation & Stats

Question:

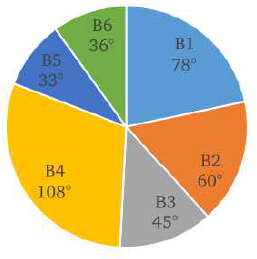
Study the given pie-chart and answer the question that follows.
The following pie chart shows the sectors representing the shares of the number of chairs produced in a given year of each of six different brands in terms of the central angles (in degrees) with respect to the total number of chairs produced in that year of all the six brands taken together.

If the total number of chairs produced of these six brands taken together is 7200, then what is the total number of chairs produced of brands B2 and B3 taken together?

Options:

1750

2400

2100

1800

Correct Answer:

2100

Explanation:

Total number of chairs produced = 7200

Number of chairs produced of brands B2 and B3 = \(\frac{60+45 }{360}\) × 7200

= \(\frac{105 }{360}\) × 7200

= 2100