CUET Preparation Today
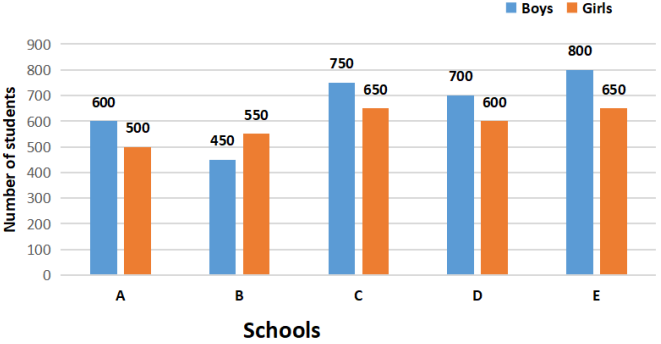
The given bar graph represents the number of boys and girls in five different schools. Read the graph and answer the question that follows.
What is the ratio of the girls from schools A, B and C taken together to the boys from all schools taken together? |
33 : 17 17 : 33 66 : 59 59 : 66 |
17 : 33 |
Number of girls in A , B & C : Number of boys in all ( 500 + 550 + 650 ) : ( 600 + 450 + 750 + 700 + 800 ) 1700 : 3300 17 : 33 |