
CUETMOCK
  • Pricing
  • Mentors
Log inStart freeStart free mocks→

First test, then trust

Try a free CUET mock test.

Join 5,00,000+ students who rehearsed exam day on the exact NTA screen before sitting CUET. On the web and on Android.

Start free mocks →Get the Android app
CUETMOCK

India's #1 CUET Mock Test Platform. Original NCERT-based questions on the exact NTA exam screen — trusted by 5,00,000+ students since CUET 2022.

Get it onGoogle PlayScan to download the CUETMOCK app

Mock tests

  • CUET mock test series
  • Browse all papers
  • Commerce mocks
  • Humanities (Arts) mocks
  • Science mocks
  • Languages & GAT mocks
  • Free practice questions
  • Pricing

Resources

  • CUET exam guide
  • CUET syllabus
  • Universities accepting CUET
  • Expert blogs
  • News & notifications
  • Webinars & counselling
  • CUET score calculator
  • How we estimate your rank
  • FAQs

Company

  • About us
  • Our leadership & team
  • Our toppers
  • Mentors
  • For schools
  • Contact us
  • Terms
  • Privacy
  • Refund policy

Talk to us

+91 7696 6630 56info@cuetmock.comWhatsApp us

Our other platforms

  • JEE Mock — For IIT-JEE aspirants
  • NEET Mock — For NEET aspirants

Newsletter

Exam updates, study material and offers — no spam.

© 2026 NYC Ventures Pvt. Ltd.

701-702, Royal Business Park, Zirakpur, Punjab - 140603

  • Terms of use
  • Privacy policy
  • Refund policy
  • Contact us

iCUETMOCK is an independent preparation platform, not affiliated with the National Testing Agency (NTA). Always check exam details on the official NTA website.

  • Home
  • Mock tests
  • CUET guide
  • Pricing
  • Log in
Home/Practice questions/Biology
BiologyBiodiversity and Conservation

Which of the following correctly expresses the equation for species-…

Which of the following correctly expresses the equation for species- area relationships Where (S=Species richness, A=Area, Z=slope of line (regression coefficient), C=Y-intercept

Answer & explanation+

Correct answer: option 2

The correct answer is Option (2) → \( \log S=\log C+Z \log A \)

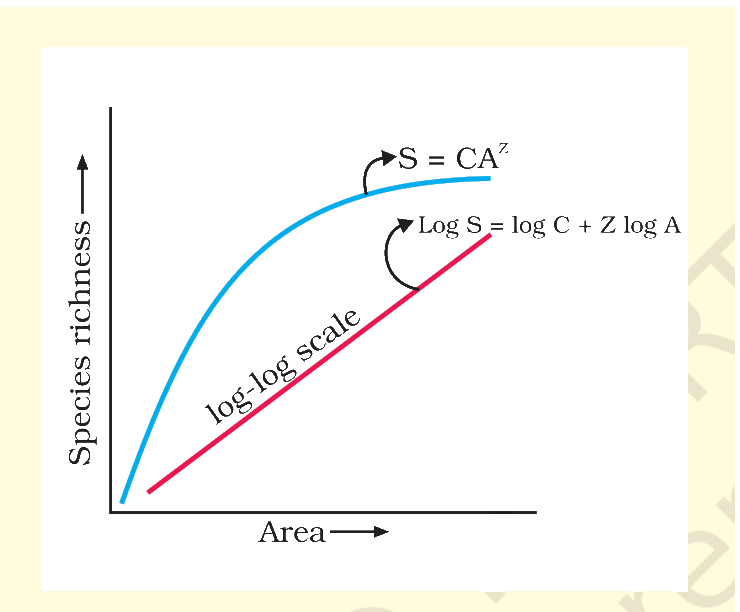
Species richness rises with the area explored. On a log scale the relation is a straight line: the log of species richness (S) equals the log of the intercept (C) plus Z times the log of the area (A), Z being the slope.

Option (1) \( \log S=\log C/A \log Z \) — Incorrect. It divides by A and puts Z inside the log; a straight-line form has the slope multiplying log A.

Option (2) \( \log S=\log C+Z \log A \) — Correct. The relationship S = CAZ is a rectangular hyperbola; on a log scale it becomes the straight line log S = log C + Z log A, where Z is the slope and C the Y-intercept.

Option (3) \( \log S=\log C-Z \log A \) — Incorrect. A minus sign would mean fewer species in a larger area, the opposite of what is observed.

Option (4) \( \log S=Z \log C-\log (A)^2 \) — Incorrect. It puts the slope on C and subtracts the area term; neither fits the relation.

NCERT Extract:
Patterns of Biodiversity – “… (ii) Species-Area relationships : During his pioneering and extensive explorations in the wilderness of South American jungles, the great German naturalist and geographer Alexander von Humboldt observed that within a region species richness increased with increasing explored area, but only up to a limit. In fact, the relation between species richness and area for a wide variety of taxa (angiosperm plants, birds, bats, freshwater fishes) turns out to be a rectangular hyperbola (Figure13.2). On a logarithmic scale, the relationship is a straight line described by the equation
log S = log C + Z log A
where
S= Species richness   A= Area
Z = slope of the line (regression coefficient)
C = Y-intercept
Ecologists have discovered that the value of Z lies in the range of 0.1 to 0.2, regardless of the taxonomic group or the region (whether it is the plants in Britain, birds in California or molluscs in New York state, the slopes of the regression line are amazingly similar).”
Textbook figure

Figure 13.2 Showing species area relationship. Note that on log scale the relationship becomes linear

Advertisement

Practise more on Biodiversity and Conservation

Chapter-wise mocks on the real NTA exam screen, with solutions and your rank. Your first mocks are free.

Start free mocks →

Advertisement

Next questions

  1. Pipes A and B can fill an empty tank in 12 minutes and 18 minutes respectively. The tank is empty and both pipes are opened together for 3…General Aptitude Test · Numerical Ability
  2. Which of the following is NOT among the broad objectives of the Pradhan Mantri Krishi Sinchayee Yojana?Geography · India-People and Economy: Water resources
  3. A parallel beam of light of wavelength 700 nm falls on a narrow slit and the resulting diffraction pattern is observed on a screen 1.5 m aw…Physics · Wave Optics
  4. The value of tan^-11/2+tan^-11/3, isMaths. Section B1 · Inverse Trigonometric Functions
  5. Who among the following is a famous violinist?General Aptitude Test · General Knowledge
  6. What is the function of pericarp ?Biology · Reproduction in Organisms
  7. Which method is used to provide a sacrificial electrode of another metal (like Mg, Zn, etc.) which corrodes itself but saves the object?Chemistry · Physical: Electro Chemistry
  8. Due to negative impacts of fertilizers and pesticides, various steps have been taken. One such step includes use of pesticides based on pla…General Aptitude Test · General Knowledge
  9. Historians use one term for the sum of the relationships of cooperation, competition and conflict that the student found between peasants a…History · Medieval India: Peasants, Zamindars and the State
  10. In the given question, a statement of Assertion is followed by a statement of Reason. Mark the correct answer. Assertion: Akbar abolished t…History · Medieval India: Kings and Chronicles