CUET Preparation Today
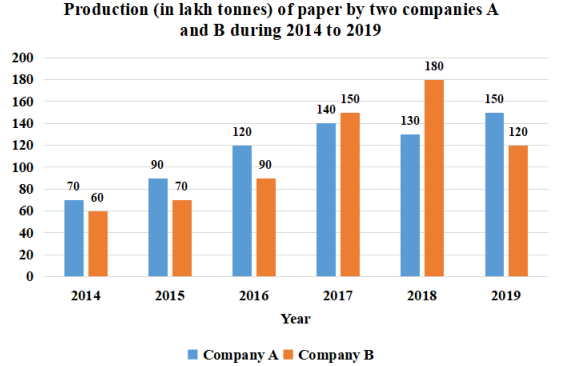
Study the given graph and answer the question that follows.
What is the ratio of the total production of paper by company A in 2016 and 2019 to the total production of paper by company B in 2014 and 2017? |
9 : 7 3 : 2 5 : 4 8 : 5 |
9 : 7 |
Total production of paper by company A in 2016 and 2019 : Total production of paper by company B in 2014 and 2017 ( 120 + 150 ) : ( 60 + 150 ) 270 : 210 9 : 7 |