CUET Preparation Today
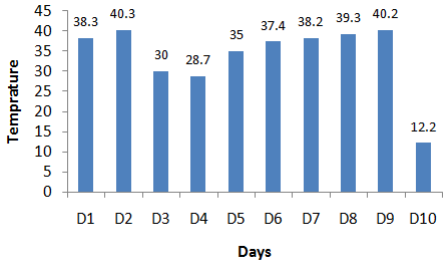
The Bar graph given below presents the maximum temperature (in °C) of a city for 10 different days spread over several months.
What is the average maximum temperature of the city per day for the given ten days? |
32.96° C 33.96° C 35.96° C 44.96° C |
33.96° C |
Average maximum temperature of the city = \(\frac{38.3 + 40.3 + 30 + 28.7+35+37.4+38.2+39.3+40.2+12.2}{10}\) = \(\frac{ 339.6 }{10}\) = 33.96° C |