CUET Preparation Today
CUET
General Aptitude Test
Quantitative Reasoning
Data Interpretation & Stats
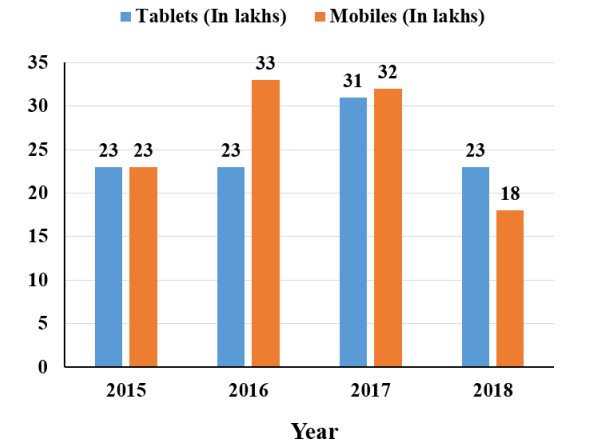
The bar graph shows the production of tablets and mobiles in four consecutive years. Calculate the ratio of mobiles in 2015 to tablets in 2018.
2 : 5
2 : 1
1 : 2
1 : 1
Mobiles in 2015 : Tablets in 2018
23 : 23