CUET Preparation Today
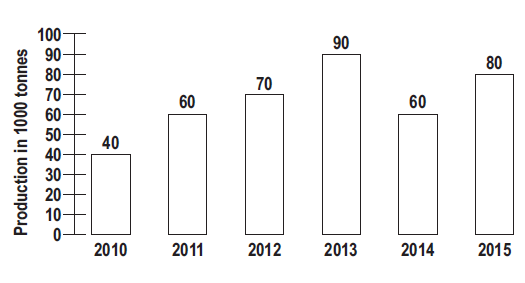
The bar chart shows the production of sugar by a company (in 1000 tons) over 6 years 210 to 2015.
The production of the year 2015 is what percent of the total production in other years. |
15% 16.66% 20% 25% |
25% |
Production in the year 2015 = 80 Total production in other years = 40 + 60 + 70 + 90 + 60 = 320 Req. Percentage = \(\frac{80}{320}\) × 100 = 25% |