CUET Preparation Today
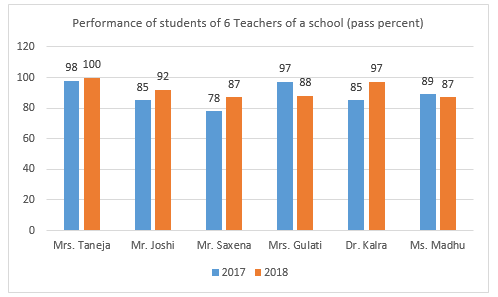
The given graph shows the pass percentage of students taught by six teachers of a school in the Senior Secondary Board exam.
Identify the teacher whose students have shown the maximum improvement. |
Mrs. Taneja Mr. Saxena Dr. Kalra Mr. Joshi |
Dr. Kalra |
Lets solve one by one for each option . 1. Mrs. Taneja Pass percentage of students in 2017 = 98 Pass percentage of students in 2018 = 100 Improvement in performance = 100 - 98 = 2 2. Mr. Saxena Pass percentage of students in 2017 = 78 Pass percentage of students in 2018 = 87 Improvement in performance = 87 - 78 = 9 2 . Dr. Kalra Pass percentage of students in 2017 = 85 Pass percentage of students in 2018 = 97 Improvement in performance = 97 - 85 = 12 3. Mr. Joshi Pass percentage of students in 2017 = 85 Pass percentage of students in 2018 = 92 Improvement in performance = 92 - 85 = 7 So , Maximum improvement is shown by students of Dr. Kalra.
|