CUET Preparation Today
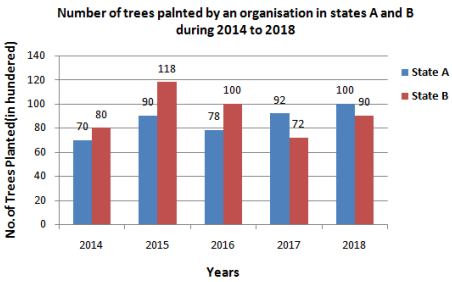
Study the bar graph and answer the question.
In how many years was the number of trees planted in state B more than the average number of trees planted in state A over the years? |
4 3 1 2 |
3 |
Average number of trees planted in A = \(\frac{70 + 90 + 78 + 92 + 100}{5}\) = \(\frac{ 430}{5}\) = 86 In state B trees planted in year 2015 , 2016 & 2018 is 118 , 100 & 90 respectively which is more than 86. Ans :- 3 |