
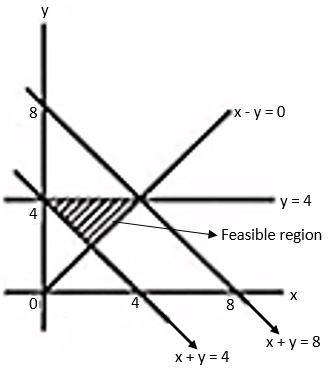
Which of the following graph represents the given constraints ?
$x+y ≤8, x+y ≥4, x-y≤0, y≤4, x≥0, y ≥0$
Answer & explanation
Correct answer: option 3
The correct answer is Option (3)
Which of the following graph represents the given constraints ?
$x+y ≤8, x+y ≥4, x-y≤0, y≤4, x≥0, y ≥0$
Correct answer: option 3
The correct answer is Option (3)