CUET Preparation Today
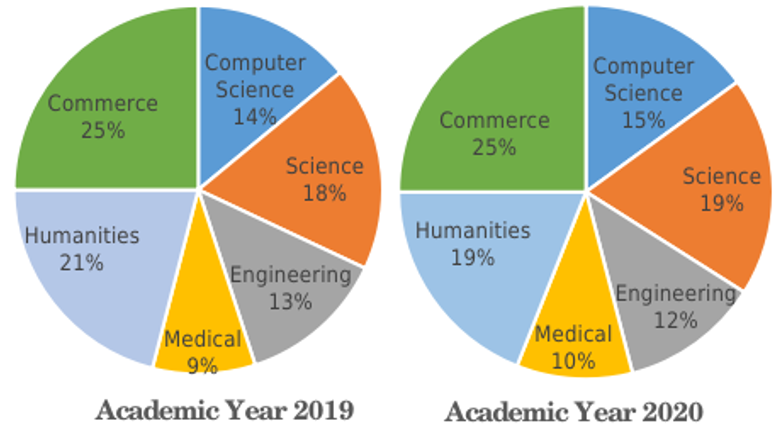
The following pie charts show the number of students studying in different departments of an institute during the academic years 2019 and 2020 . The total number of students was 2000 and 2400 , respectively, in academic years 2019 and 2020. What is the ratio of Commerce and Computer Science students taken together in 2019 to Engineering and Medical students taken together in 2020 ?
|
44 : 65 65 : 44 22 : 39 39 : 22 |
65 : 44 |
Number of Commerce and Computer Science students in 2019 : Number of engeneering and medical students in 2020 \(\frac{25 + 14 }{100}\) × 2000 : \(\frac{10 + 12 }{100}\) × 2400 \(\frac{39}{100}\) × 2000 : \(\frac{22 }{100}\) × 2400 65 : 44 |